Multifamily Rent Comp Model
Researching rent comps for an apartment building is an absolutely critical exercise for real estate investors. It's been a long time, but I will finally release my internal Comparable Rental Analysis Model to site visitors and customers.
Rent comps can be a tedious, time-consuming endeavor for various reasons, including:
Where to find rental comps
How to organize the data of your consolidated rental property intel
How to format this data (with charts and other analytics)
How to present the data
While the tutorial I'm about to embark on is for a paid tool, I am confident the pricing is reasonable and well worth the time savings to aid you in your real estate investing diligence.
Apartment Market Survey Analysis
Finding Rent Comp Information
There are many options out there that you can use to get your data. Some websites include:
Zillow
Rentometer
Craigslist
Databases (CoStar, Axiometrics, Yardi)
I will scour apartments.com. This is a service property management companies will pay to post all their rental listings for vacant units. The data is robust and has a ton of good information beyond just unit rents, such as:
Number of units at the property
The year the property was built
Concessions (or other rental specials the owner is offering)
Which utilities are included in the monthly rent
Additional ancillary charges (parking, pet, storage, etc.)
Above all, this is timely, accurate information that will give you a true sense of the market rent for a given property and how it stacks up with other properties in the rental market (verifying the data by calling the property is always recommended).
I will frequently verify the information on apartments.com with the property's website, and I'm not afraid to call the property manager and ask questions. It's prevalent for leasing agents and property managers to field questions from other properties and investors in the submarket as a "market survey." Please don't feel like you are inconveniencing them.
Gathering sound intel at this due diligence stage will be essential in formulating your proforma rent estimates and estimating the total potential rental income your prospective investment property can achieve.
Rent Comp Tutorial
The Rent Comp Analysis Template I offer clients and website visitors has only two tabs.
Tab 1 - Rent Comp Inputs
Tab 2 - Rent Comp Analytics
Behind the scenes, I have macros that will automatically refresh charts, color the data points, resize the chart axes, and rescale the graphs depending on how many comps you input on tab one.
You do not have to format anything, create charts, type/format data labels, or worry about mistakes; it is all on autopilot.
Enable Macros
Note: Upon opening the workbook, you will need to "Enable Macros" to ensure the automated formatting works.
Like all Tactica tools, brown text cells are your responsibility. Black text cells are labels or formulas; you shouldn't need to amend them. If you do, please do so with extreme caution.
Rent Comp Inputs
The first tab is dedicated solely to data entry. The first section is where you'll input all the general property information.
General Property Data
Comps Limitation: The tool allows for up to eight comparable properties.
The first entries you'll make for each comp:
Property Name
Year Built
Occupancy (as a percentage)
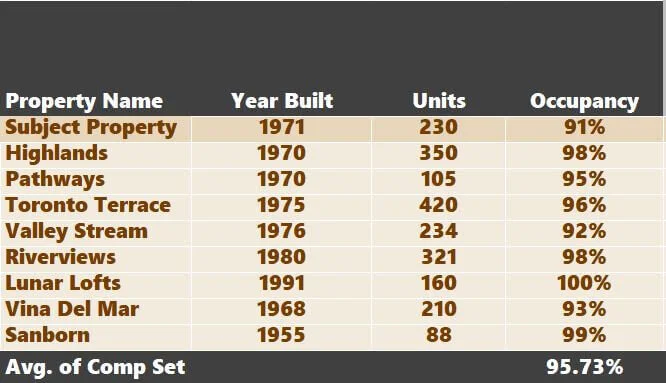
I have already entered eight comps.
The next step is rating the properties on various features. The tool will allow you to do this on a 5-point or 10-point scale.

The criteria I am ranking are:
Location
Kitchens
Bathrooms
Floorplans/Living Areas & Bedrooms
Community Amenities
Common Areas
Your criteria can be anything. Perhaps instead of "Common Areas," you wanted to rank "Access to Public Transportation," you can overwrite that category.
I am using a 10-point scale in the image above. A "10" would indicate pristine finishes, an unbeatable location, or an unrivaled amenity spread. A "1" would show original, dated finishes, a bad location with limited walkability, and no amenities.
In summary, a "10" or a "5" (on a 5-point scale) are the unmistakable leaders of the comparative market analysis.
Optional: This "ranking" section is optional if you want to skip it and focus solely on rents. The model quickly hides charts and graphics you wish to exclude from the analysis.
Rental Information
The following section is dedicated to entering the actual rental rates, square footage, concessions of the subject property, and comps.
Limitation: The model will allow you to analyze three different unit types for rent comp. In the example I'm about to show you, I am comparing:
Studio Units
One Bedroom/One Bath Units
Two Bedroom/One Bath Units
You'll need to enter what the unit type is for a given section:

Then, enter the property, unit renovation status, square footage, and rental price.
The property will populate with a drop-down list dependent on the general property information you input earlier.
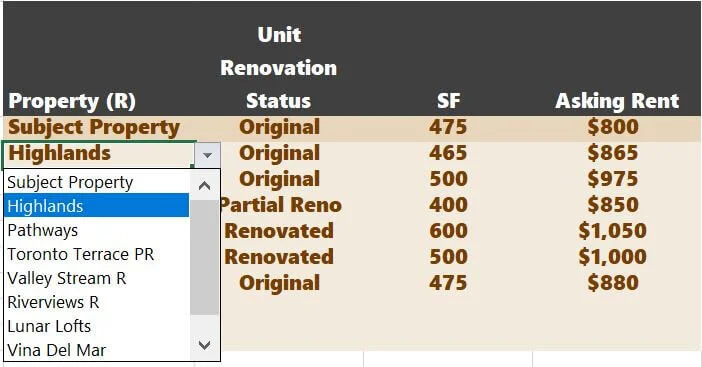
The Renovation Status will also be a drop-down list that gives you three options:
Original
Partial Reno
Renovation
This will be a helpful determination once we look at all the visuals later.
Concessions
You can enter in concession info either as "months" or a dollar amount.

Many properties will quote concessions as "one-month free" or "half-month free," like in the example for the subject property above. If there are no concessions, leave both columns blank.
Utility Rebill
I think it's also essential to look at which properties bill back for utilities. Apartments.com will usually include info on which utilities are included in rent and which ones the renters pay for. You may need to estimate what this rebill would be. If you call a comparable property a "prospective" renter, ask the leasing agent, "What are the estimated water and trash expenses monthly?" They should be able to give you a ballpark number.

I will show you why this information is critical shortly. You'd follow the same steps for all three sections (you don't need to populate all three sections if you are only analyzing one or two floorplans.
Rent Comp Analytics
Your work is pretty much complete! Now, we can analyze the data.
Macro Reminder: I use macros in this workbook to refresh graphics on this tab. This takes out all of the tedious work for you. The macros will:
Format chart axes
Color the "Subject" property differently from the comps
Update the data automatically as you change rents, units' square feet, etc.
Upon opening this workbook, Excel will ask if you want "to enable macros." You must select "Yes."
You control the macro with this button:

Anytime you change or alter data, click the button for a seamless reformat.
General Property Info
This is where all general property information along with the ranking system will display.

Chart 1: Rach property's occupancy and comparison to similar properties.
Chart 2: The ranking totals of each property.
Chart 3: How the subject property compares to the comp set (on average) for the six ranking criteria
Chart 4: Pick a comp (any of the eight comps), and the chart will show you how the subject property compares to the six ranking criteria.
Unit SF & Rents
This section summarizes the rental data for each comp, along with the comp set's min, max, and average data.

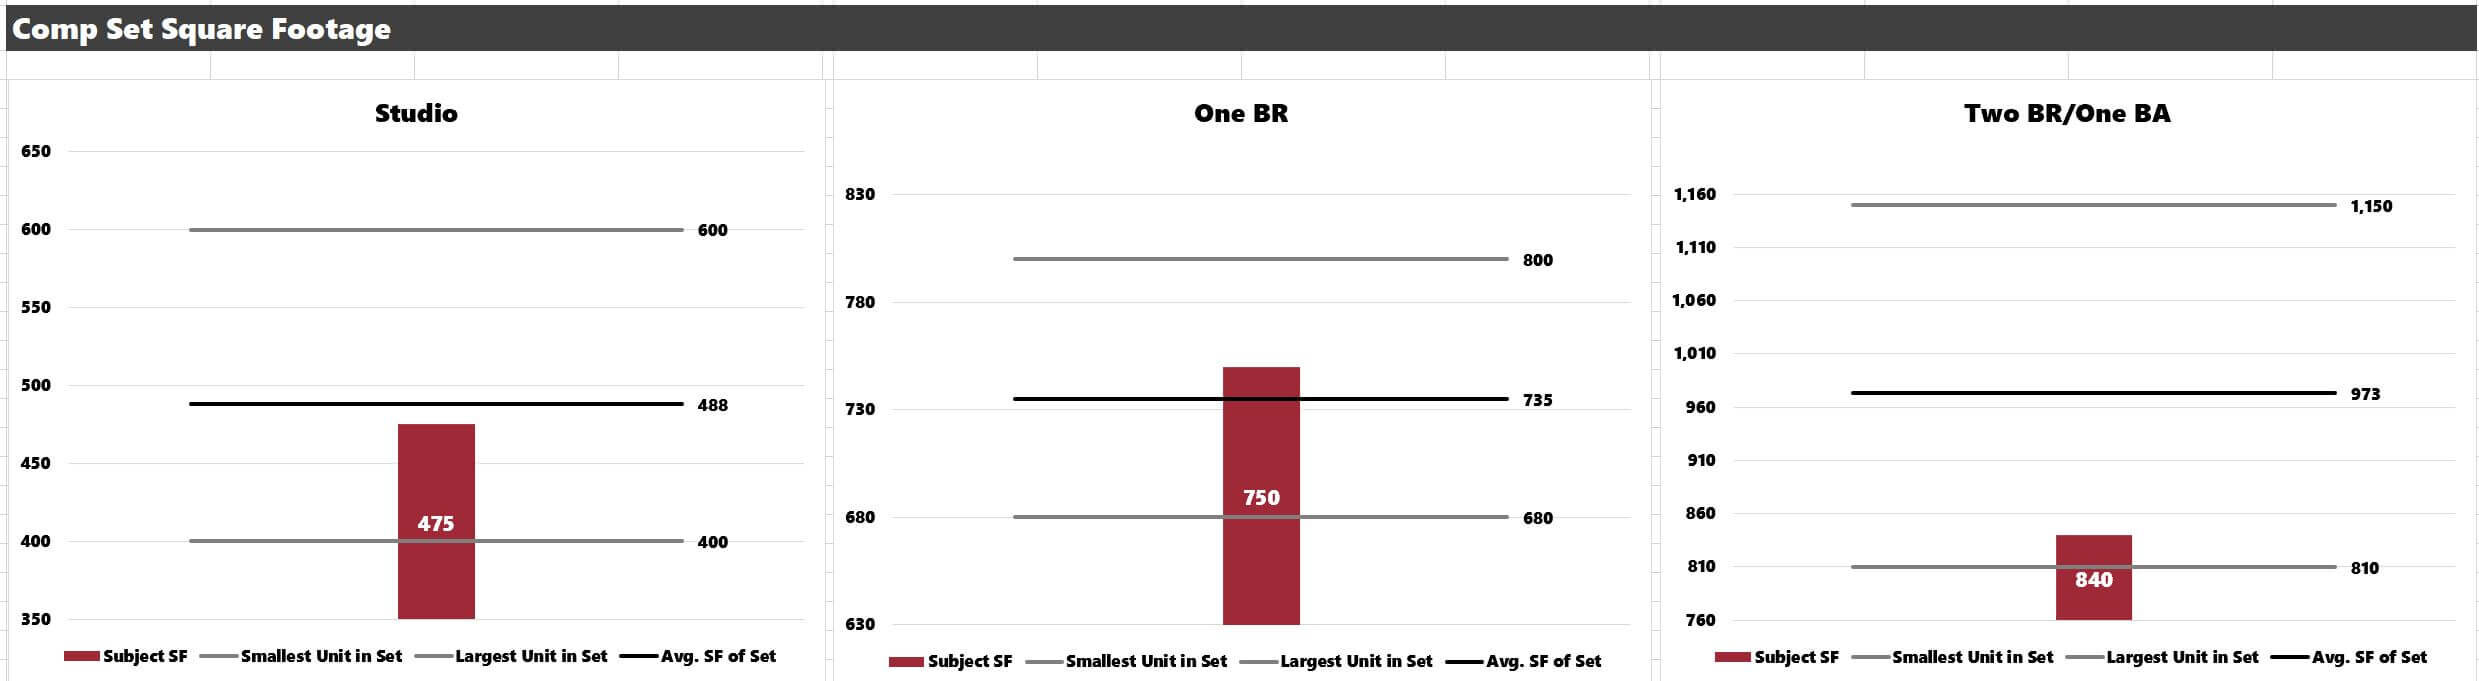
Comp Set Square Footage
It's essential to know how the subject property's unit compares to the comps in the square footage. These charts show how each floorplan stacks up to the rest of the comp set. The average, smallest unit, and most spacious unit in the comp set are all summarized for each floorplan.
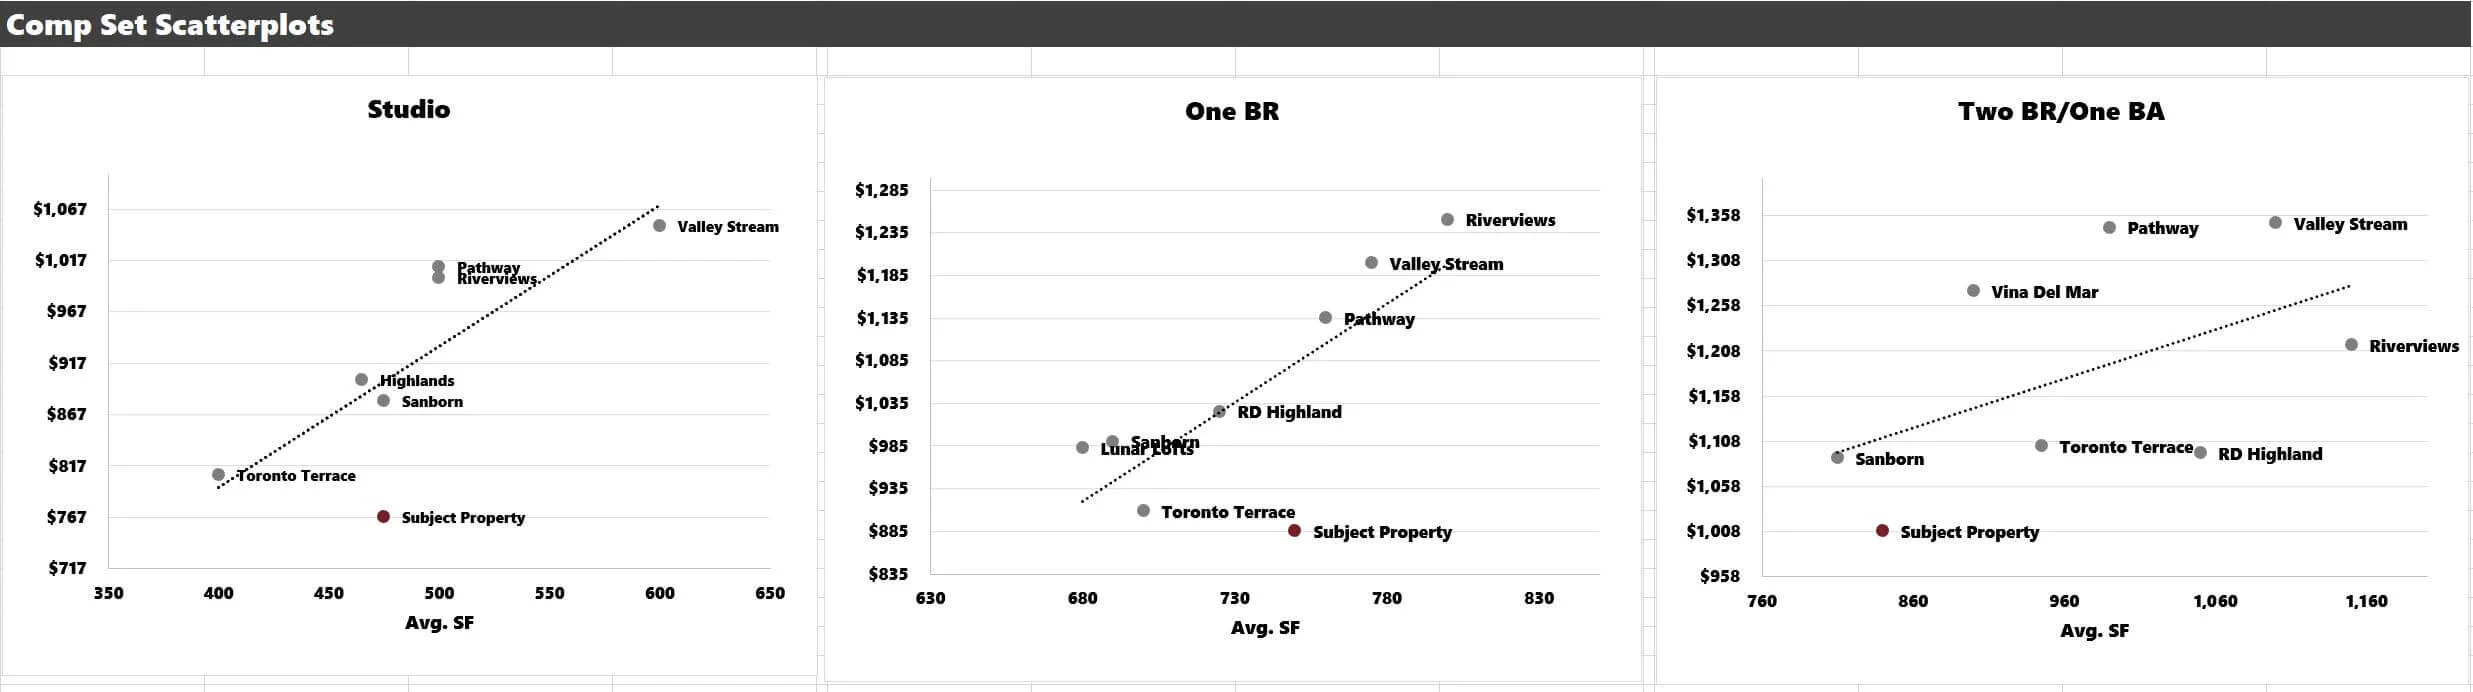
Scatterplots
The following section shows scatter plots for each unit. Square footage is on the x-axis, while rents are on the y-axis. A trend line will populate automatically. If the subject property is under the trend line, there may be an excellent opportunity to raise rents.
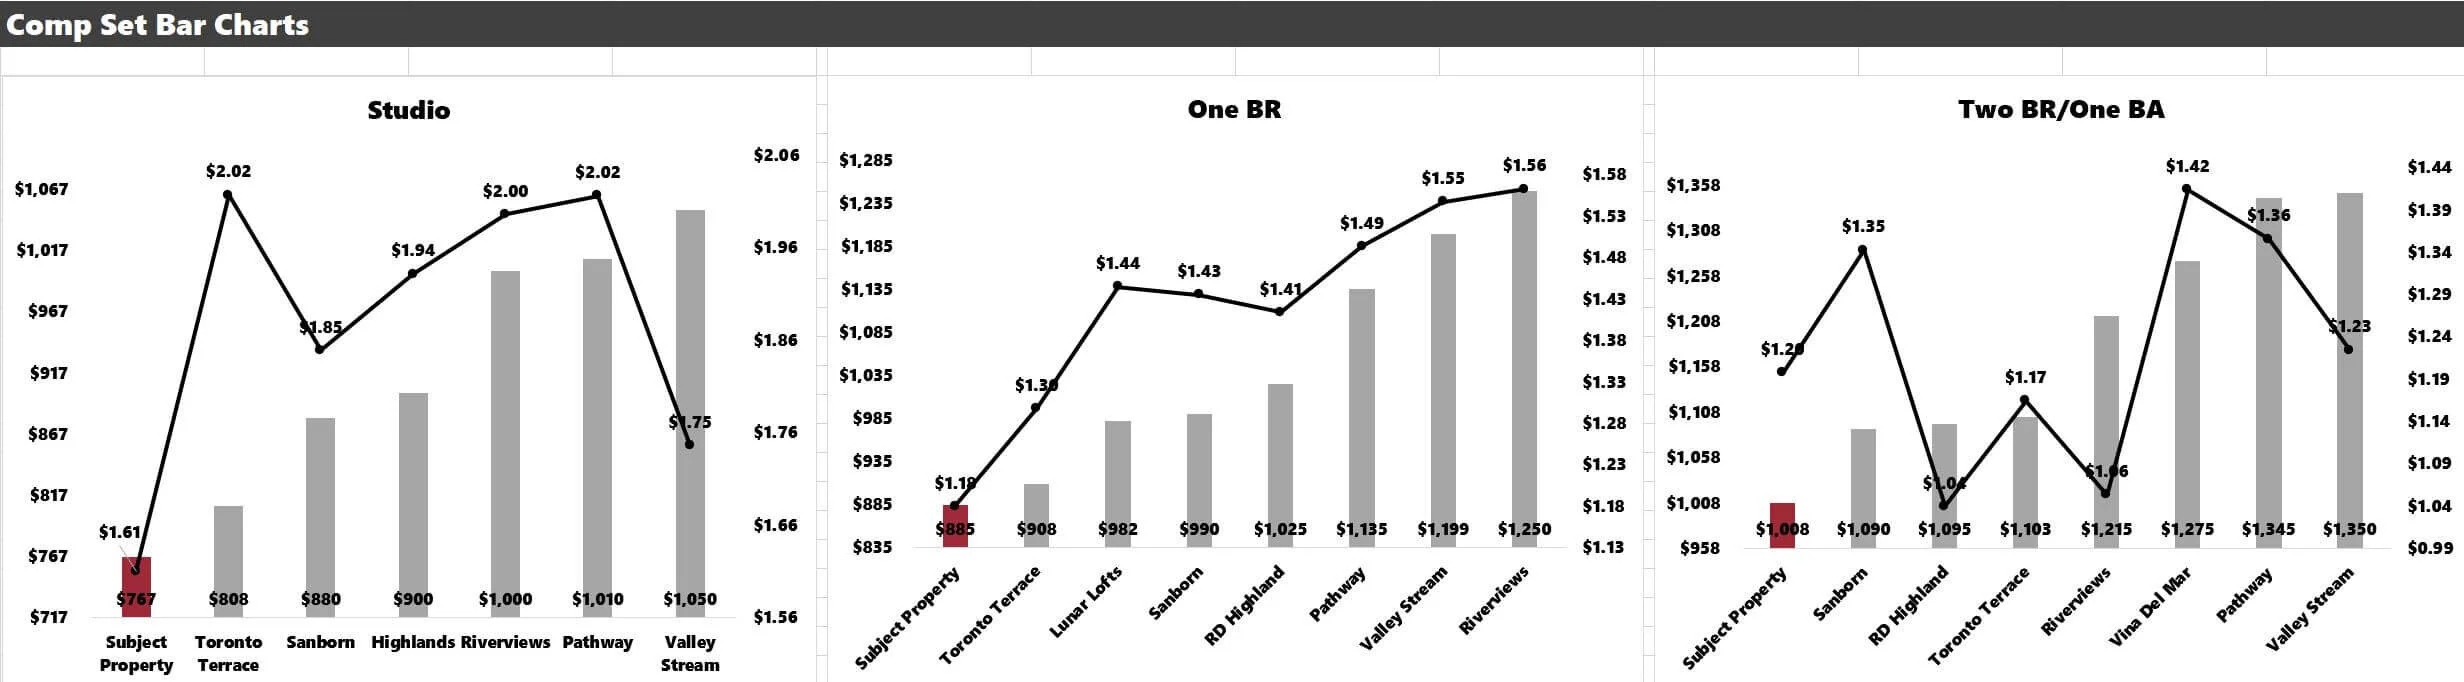
Bar Charts
The final section summarizes the rental data with bar charts.
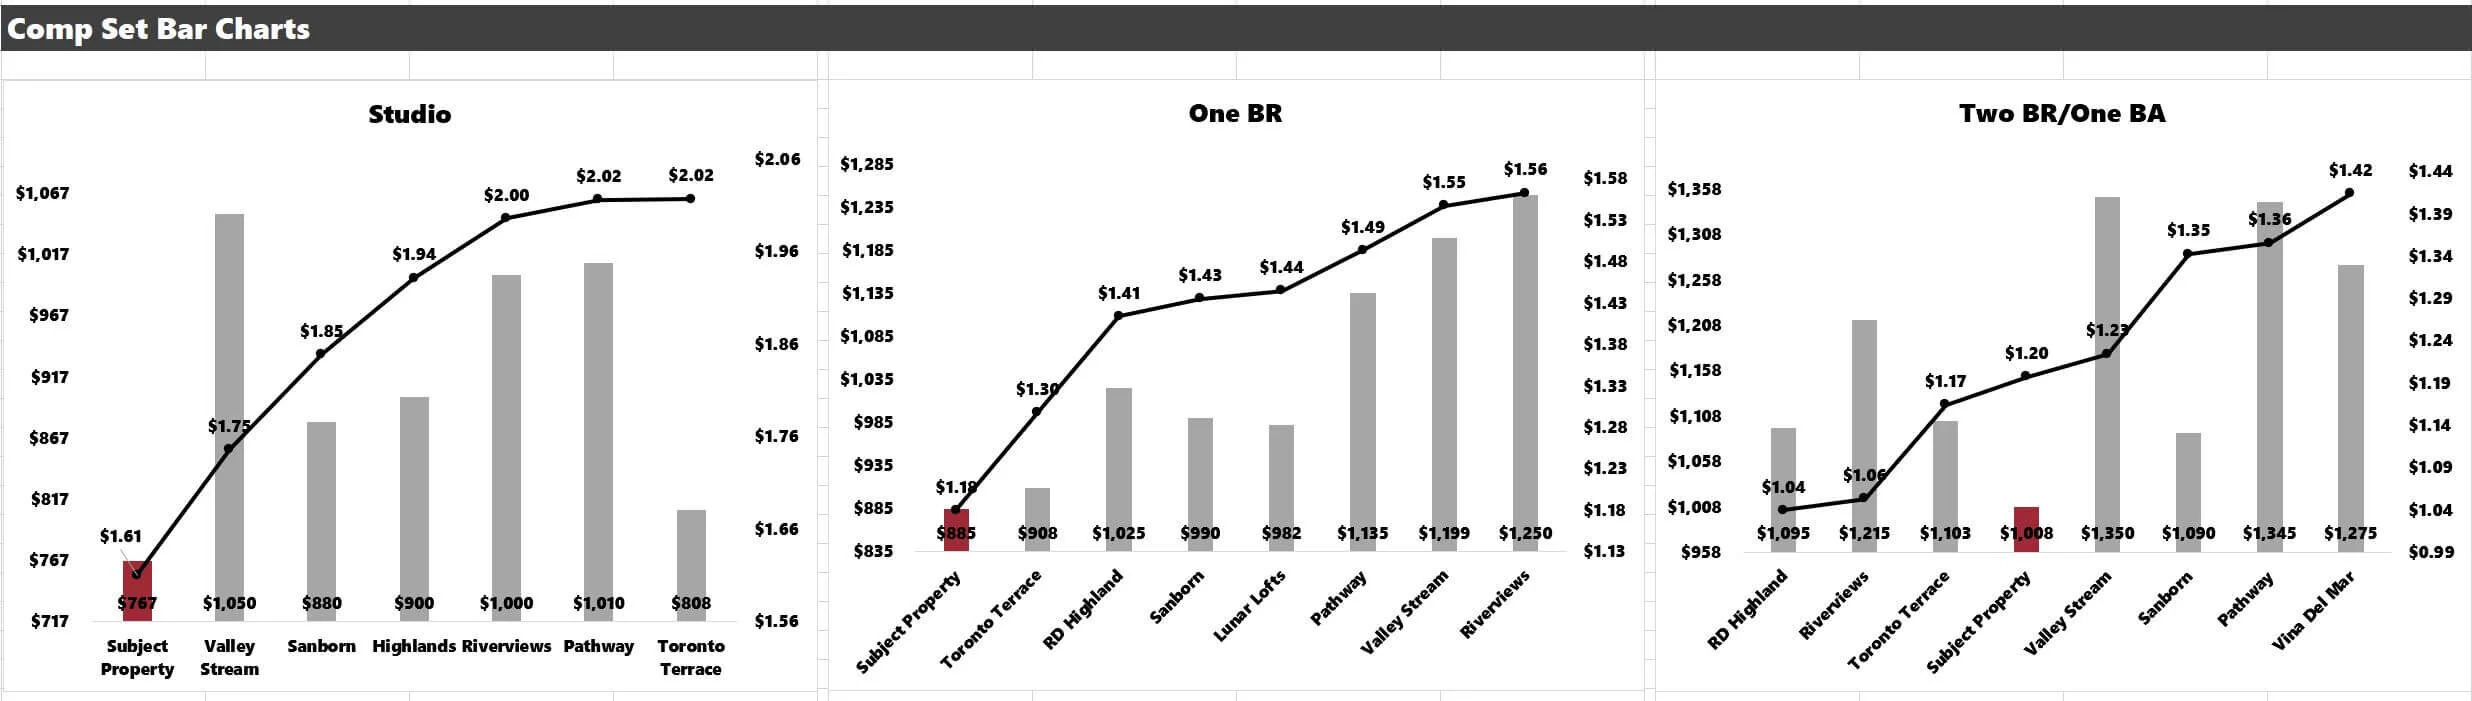
Currently, the properties are ranked by “Rent PSF.” If you prefer to organize the data by "average rent," at the top of the workbook, you will select "Rents."

And then click the button.
Now, all rents are sorted by “chunk” rents.
Finalizing
Remember how when we inputted data, we entered concession data and RUBS details?
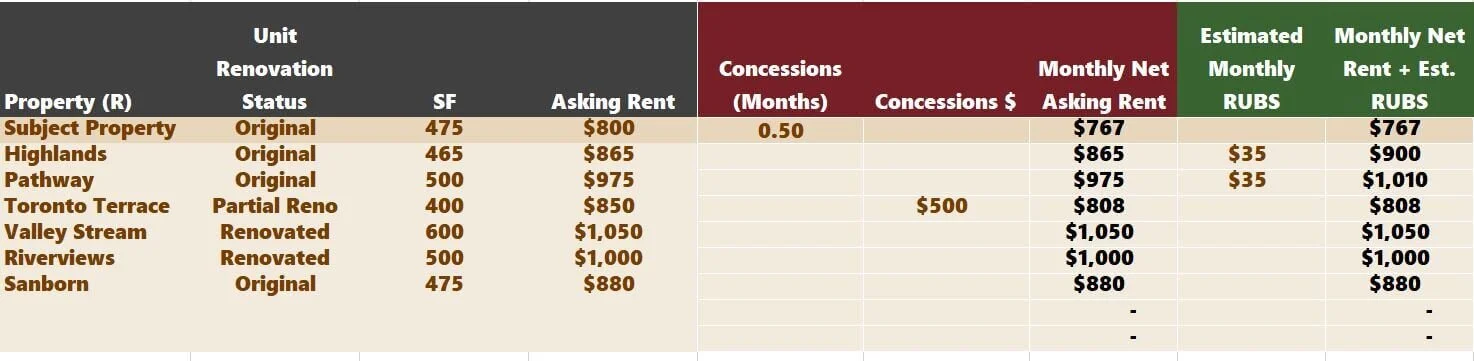
The final piece you control on this tab is how you want the data to display. Your options are:
Asking Rent
Effective Rent (Asking Rent adjusted for concession)
Effective Rent + RUBS reimbursement
You choose here:

Depending on what you select will determine which rents are displayed in the charts and graphics. I love to compare the rent prices, including all concession and RUBS information. Without these two pieces of data, the comp set is incomplete, and determining the "right price" for” may be challenging.
Video Tutorial
Excel Resources
If you're interested in the inner workings of Tactica tools to maximize their utility with advanced Excel knowledge, we recommend visiting these articles:
We plan to publish more posts about the commonly used Excel functions and the major analysis components within the Tactica workbooks.
Summary
Rent comps are crucial when analyzing a potential acquisition or development opportunity. Good rental comp data may not be glamorous, but all the most successful investors I've met over the years never skimp on this part of the diligence. Local market trends will play a significant role in any investment outlook, and rent comps will be a big piece of the overall picture.
If you want more information about this tool for your potential use, please check out the rent comp analysis sales page for more details, and don’t forget to watch the video.