Real Estate Investment: Don't Overlook State Net Migration
This article will discuss net migration at the state level in the United States. While international migration is also a trend to pay attention to, I don't want to go outside of the scope of domestic migration in this blog post. I will show you where to find migration data and how to interpret it.
Net Domestic Migration
If you are a real estate investor, the states you choose to invest in are affected by population changes. If you think about it, it’s a giant competition between states to attract residents, businesses, and investment. Enticing new residents from other states can be a massive boon for the local economy and make the investment outlook much brighter than a state losing people annually.
Contents
Update: This article is now outdated. For the latest domestic migration trends, please check out our article “Which State is the Best to Invest In?”
Domestic Migration Motivations
People move to different states for a wide variety of reasons.
Jobs
Throughout history, workers have followed employment opportunities. A college graduate studying finance in the Midwest could have more success finding a job in a financial hub such as Manhattan, New York, or Chicago, Illinois. A recently minted computer programmer from Vermont may succeed more in San Jose, California, or upcoming tech cities such as Raleigh, North Carolina, Austin, Texas, or Denver, Colorado. Generally, if unemployment is high in a particular region, skilled labor force participants may seek greener pastures elsewhere in the county.
Taxes
Businesses have motivations to settle in more tax-friendly states. A company headquartered in Massachusetts looking to expand to multiple locations may choose Nevada over Arizona because Nevada doesn't have a state income tax, while Arizona does.
Lifestyle & Demographic Shifts
A retired couple in Pennsylvania may relocate to Florida because of Florida’s favorable climate and no state income tax obligation on their monthly pension payments. It's no mystery why so many residents in the Northeast flock to Florida during their golden years.
Affordability
A dollar is not equal in every state. A house in Atlanta, Georgia, will be cheaper on average than a similar home in Seattle, Washington. A gallon of gasoline in Honolulu, Hawaii, will be more costly than a gallon in Nashville, Tennessee. Cost-of-living information is accessible to anyone with an internet connection. Affordability is arguably more prevalent than ever as more employers are open to 100% remote work due to the Covid-19 pandemic.
People who were once geographically tied to jobs have more flexibility to cherry-pick a state of residence based on where their salary will go the furthest.
Tracking State Migration Flows
All things being equal, if you could choose to invest in either:
State A: Has a net positive in-migration trend (more people are moving there than leaving there)
or
State B: Has a net positive out-migration trend (more people are going there than moving there)
You'd choose State A.
Population growth is an opportunity for a real estate investor to capitalize on increasing demand for homes, rentals, office space, warehouses, storage, etc.
I track state-to-state population migration patterns using data from the U.S. Census Bureau (www.census.gov). Specifically, I want to see historical state net domestic migration statistics.
You can download an Excel workbook for whatever year you are interested in. The way the information is laid out within the Excel spreadsheet is confusing. I want to spend some time explaining this document as I couldn't find any literature that does so.
Comprehending the Migration Data
The latest data in this format compares migration between 2019 and 2018.
Firstly, consider this Excel spreadsheet broken up into two pieces.
1. Population Inflows
2. Population Outflows
Population Inflows
Columns "A" - "I" describe the population inflow data.
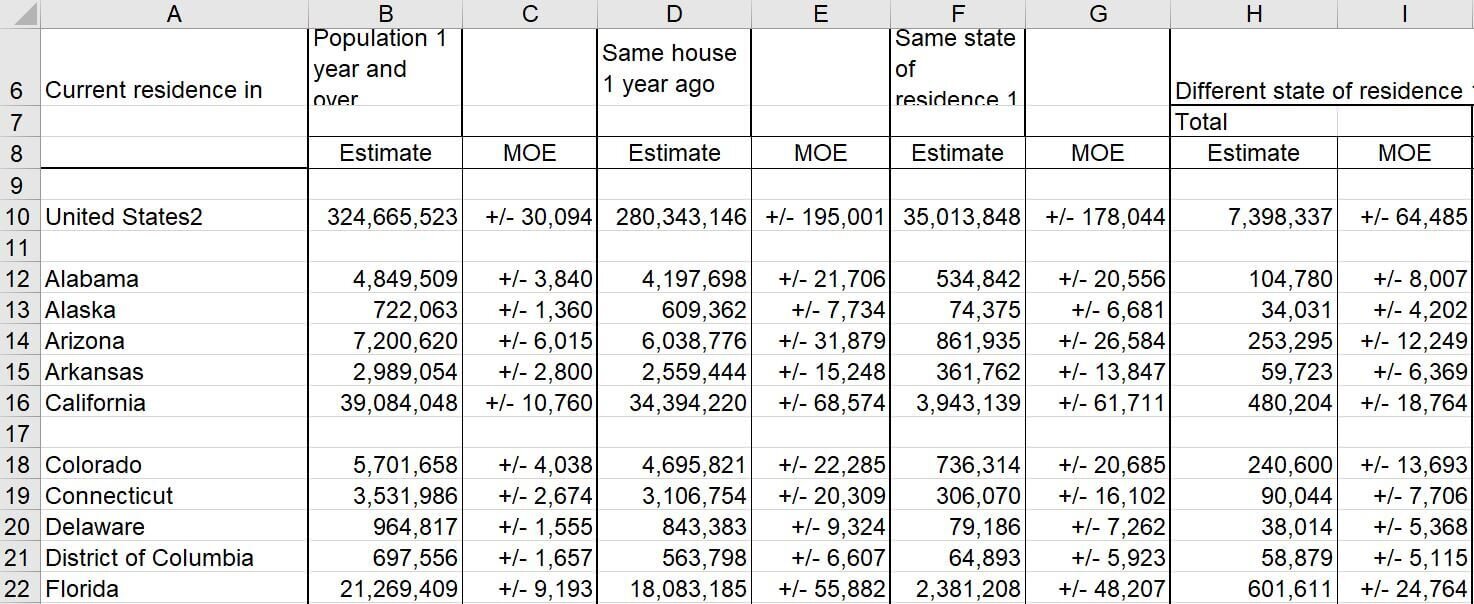
The first few columns are different variations of population estimates. The data set includes all 50 states plus the District of Columbia and Puerto Rico. The critical information in this selection is located in column "H." here, you’ll see the total domestic population inflow over the last one-year period for each state (each state’s estimated total will add up to the United States estimate of 7,398,337).

Note: “MOE” is the acronym "margin of error." Census data is based on American Community Surveys (ACS), used to estimate population trends. The number of people in the state is not going to be 100% accurate. That's ok, as we're just trying to gauge bigger-picture trends.
If we look at the District of Columbia, in 2019, 58,879 residents moved to Washington D.C. from out of state. That statistic alone doesn't exactly give use to the entire migration picture.

Population Outflows
Starting in column "J," the dataset explains the population outflows. Each state is listed from left to right in row "7."
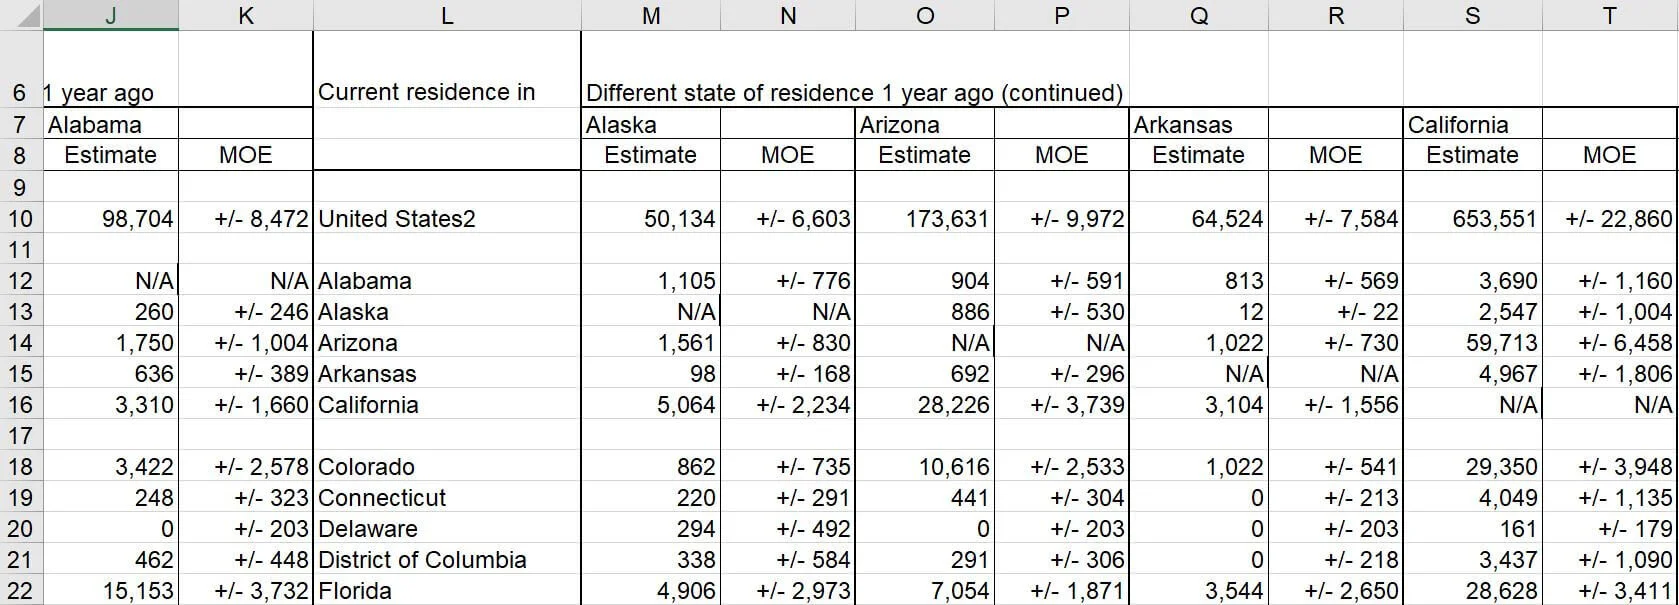
If we scroll over to the District of Columbia, population outflows for the year are summarized in row "10."
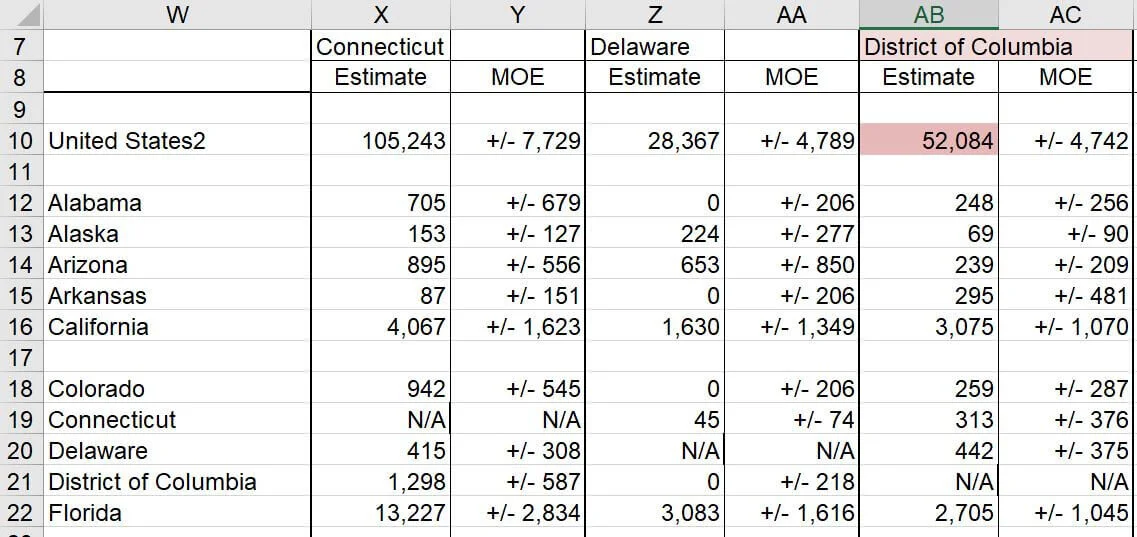
52,084 residents moved out of Washington, D.C., to reside in another state. Also, in column “AB,” you can see which states residents moved to from D.C. If you tally up all the individual states people moved to from D.C., each state total will equal 52,084.
In summary:
Washington D.C. Population Inflow: 58,879
Washington D.C. Population Outflow: 52,084
Total Population Inflow = +6,795
Washington, D.C. experienced positive domestic migration in 2019, an excellent trend for savvy real estate investors.
If you open the document and scroll down, you’ll see that most residents are moving to Virginia and Maryland (9,540 and 17,718, respectively). As business professionals get established in their careers, they move outside the D.C. urban core and set their roots in the surrounding states' suburbs.
Another Example
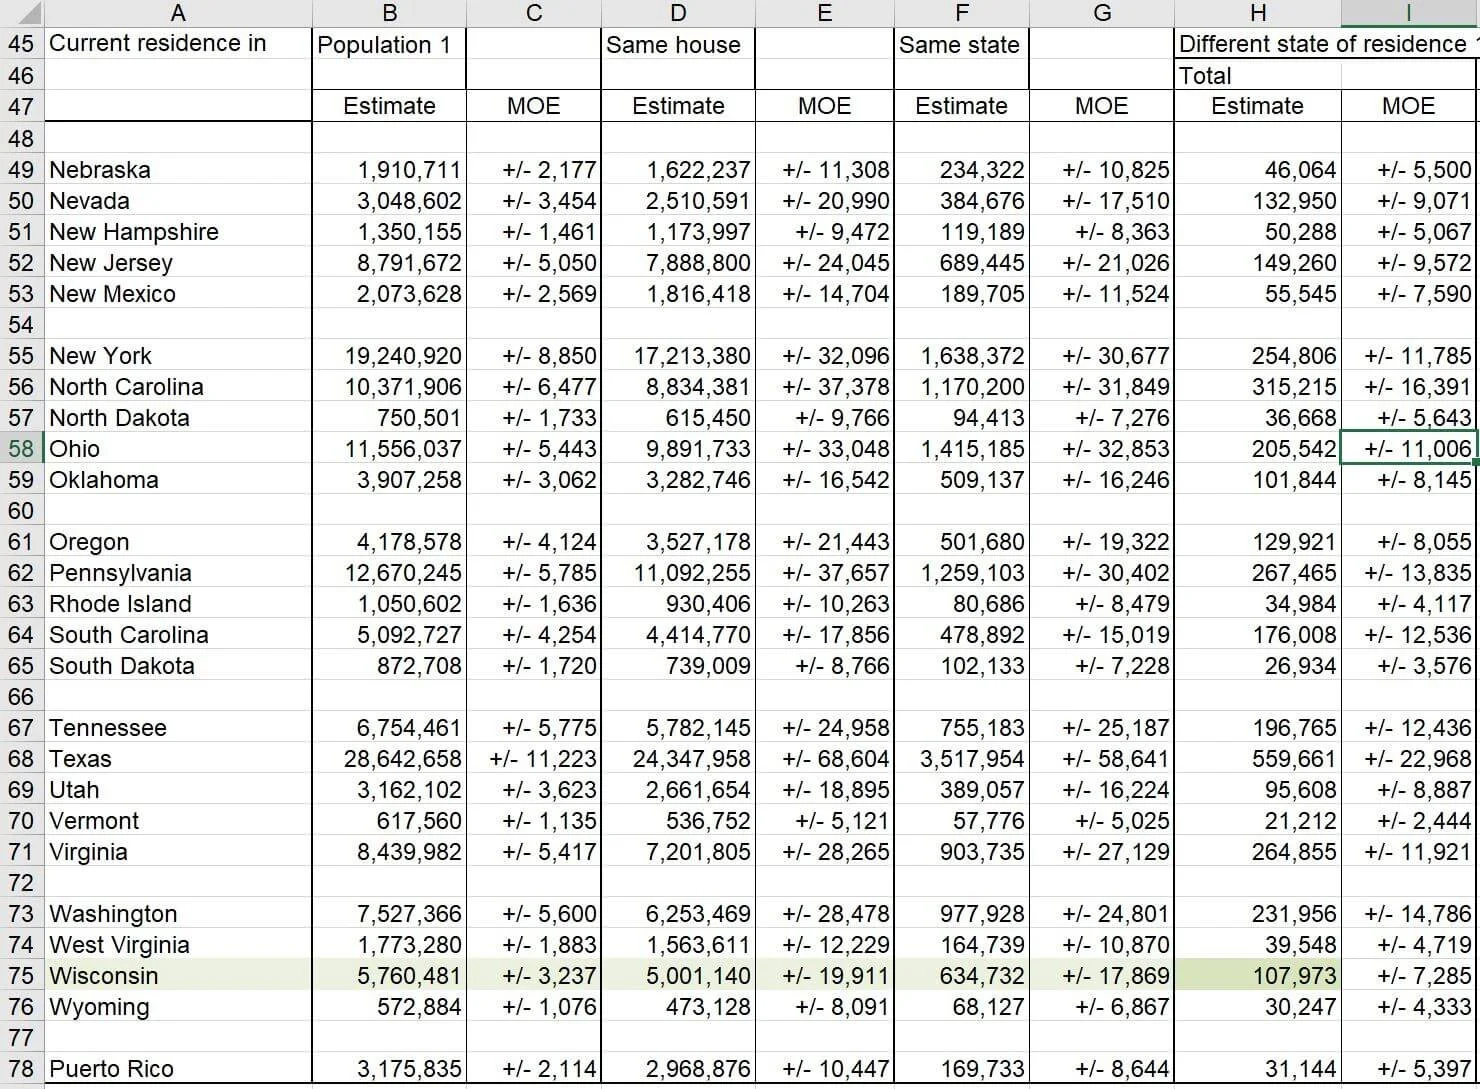
Let's take a look at Wisconsin. Wisconsin is an interesting state that is slightly positive in domestic migration.
In 2019, they gained 107,973 out-of-state residents.
In 2019 they lost 101,668

The net gain of residents was just over +6,000.
When you look at where residents were moving, it was overwhelmingly Minnesota and Illinois. Approximately 30% of domestic migrant movers went to these two states. This makes sense if you think about it. Both Chicago and the Twin Cities offer far more job opportunities than the major urban centers in Wisconsin, such as Milwaukee, Madison, Green Bay, or Eau Claire.

2021 Domestic Migration Ranking by State
I thought doing a final ranking of all states and their net migration numbers would be helpful. Unfortunately, the data set showcased above is outdated (2019). I love the detail it provides, showing who is leaving the state and where residents are going. I will keep an eye out for when this is updated.
I will use the 2021 Census Domestic Migration data for the most recent state ranking. The Excel file with 2021 domestic migration data can be downloaded at the end of the article in the “Datasets” section. The information isn’t as robust as the images above but offers semi-recent data points.
To finalize the state ranking, I will focus on two columns in this data set:
Population Estimate 2021 (Column “I”)
Domestic Migration 2021 (Column “U”)
I will rank the states by who’s had a more considerable domestic migration as a percentage of the population:
Ranking = 2021 Domestic Migration / 2021 Population Estimate
State rankings are as follows:

Net Domestic Migration Summary
Population trends have changed drastically in the past years as our workplaces evolved from the pandemic fallout. Domestic migration trends provided by the Census Bureau are essential to follow if you are a real estate investor. The states winning residents via domestic migration are poised for a bright economic outlook.
While this article's scope focuses on migration from state to state, it's also important to note that international immigration statistics are essential to follow. Some states may not attract domestic residents as successfully as international residents. While a boon of international workers is a good thing, many are only in the U.S. temporarily and don't settle permanently in their state of employment.
If you want a tool to help you with your high-level submarket analysis, check out our Interactive Labor Statistics Dashboard.
Reminder: This article is now outdated. For the latest domestic migration trends, please check out our article “Which State is the Best to Invest In?”