Tracking Unemployment Trends
The national unemployment rate is the most recited labor statistic. It is a strong indicator of the health of the labor market and the U.S. economy.
As a real estate consultant who works with clients in various cities around the United States, it behooves me to understand all employment trends at the city level. Unfortunately, a static national unemployment rate figure doesn’t do much for investors. It’s honestly meaningless unless you can investigate much further.
Contents
Unemployment Rate Definition
First, let's briefly tackle the definition of unemployment (jobless rate).
Unemployed = Individuals 16 years and older, actively looking for employment (full-time and part-time).
If a person isn't actively looking for work, technically, they are not unemployed persons.
Unemployment Rate = All Unemployed / Labor Force
Labor Force = All Employed Persons + All Unemployed Persons
A person who is unemployed and not actively looking for work is technically no longer in the labor force. Nor are they unemployed. They must actively seek out employment.
Example: As of January 2021, city XYZ has a population survey (cps) of 100. The city has 80 citizens who are 16 years or older.
70/80 qualified citizens are employed
4/80 of qualified citizens are actively trying to find work
6/80 qualified citizens have no interest in working
Unemployment Rate = 4 / 74
Unemployment Rate = 5.4%
In February, one of the four unemployed citizens decided he was fed up with his employment situation. He cancels all interviews and decides that work is no longer in the cards for him. The updated unemployment rate would be:
Unemployment Rate = 3 / 73
Unemployment Rate = 4.1%
Now, 7/80 qualified citizens have no interest in working, making them ineligible for the unemployment calculation. This results in one less person being unemployed (numerator) and one less person included in the labor force (denominator).
If you are reviewing city XYZ's economic indicators, it may look like the fundamentals improved in February. All that happened was that the civilian labor force dropped due to a lack of employment opportunities, which decreased the numerator and denominator of the unemployment equation. A lower labor force participation rate will reduce the unemployment rate.
Researching Unemployment Trends
I use two resources exclusively to analyze labor force statistics.
U.S Bureau of Labor Statistics (BLS)
Census Bureau
Bureau of Labor Statistics
The lion's share of my unemployment statistics research is done on bls.gov/lau. BLS is a unit falling under the Department of Labor that tracks labor trends in the U.S.
Disclaimer: Images below are from Tactica’s discontinued BLS dashboard. You’ll have to get this information directly from the BLS website linked above
Unemployment Example Analysis
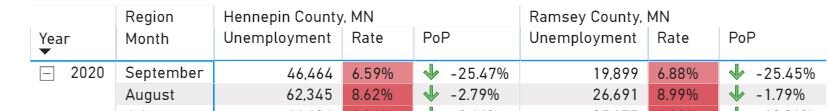
Let's say we want to compare unemployment during COVID-19 for the two most populous counties in Minnesota—Hennepin County and Ramsey County. I spend most of my time in these two counties doing investment analysis in Minnesota.

We can see that both counties' unemployment rates peaked in May and have fallen precipitously since then. As of September 2020, Hennepin and Ramsey Counties’ unemployment rates were 6.59% and 6.88%, respectively. Other conclusions you could draw from the data above are:
The unemployment rate has always been lower in Hennepin County than in Ramsey County
Both counties in September were worse off than in 2019 and 2018 (unemployment was more than 2x higher than in 2019)
Hennepin County was a more populous county than Ramsey.
It's nice to see that the unemployment rate has been falling since May. But that isn't the whole story. What if people dropped out of the labor force?
When we look at the two counties' labor force, August to September 2020 saw a severe drop in the labor force.

Hennepin lost nearly 18,000 labor force participants, while Ramsey County lost over 7,000. That's equivalent to a decent-sized suburban population no longer in the job market!
Looking at the unemployment data, Hennepin County's number of unemployed persons dropped by 16,000. Jobs weren't added back—people just stopped looking.
To go even further with this point, let's look at the gross employment numbers in Hennepin County.
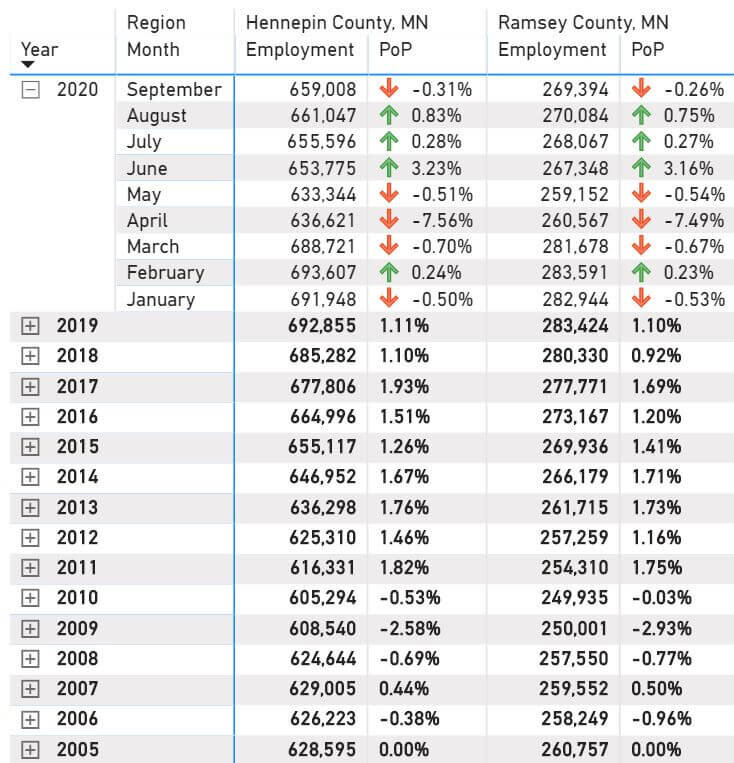
Employment was DOWN by approximately 2,000 jobs! So what happened from August to September?
Two thousand people lost their jobs and didn't try to find employment, and 16,000 got tired of looking for a job. The numerator and denominator in the unemployment equation decreased, lowering the overall unemployment rate. The same trend was unfolding in Ramsey County, albeit on a smaller scale.
U.S. Labor Force Trend
The last thing I want to do with BLS data is to see if the data specific to Hennepin and Ramsey counties follow the national trend. Let's take a look at national labor force trends in 2020.
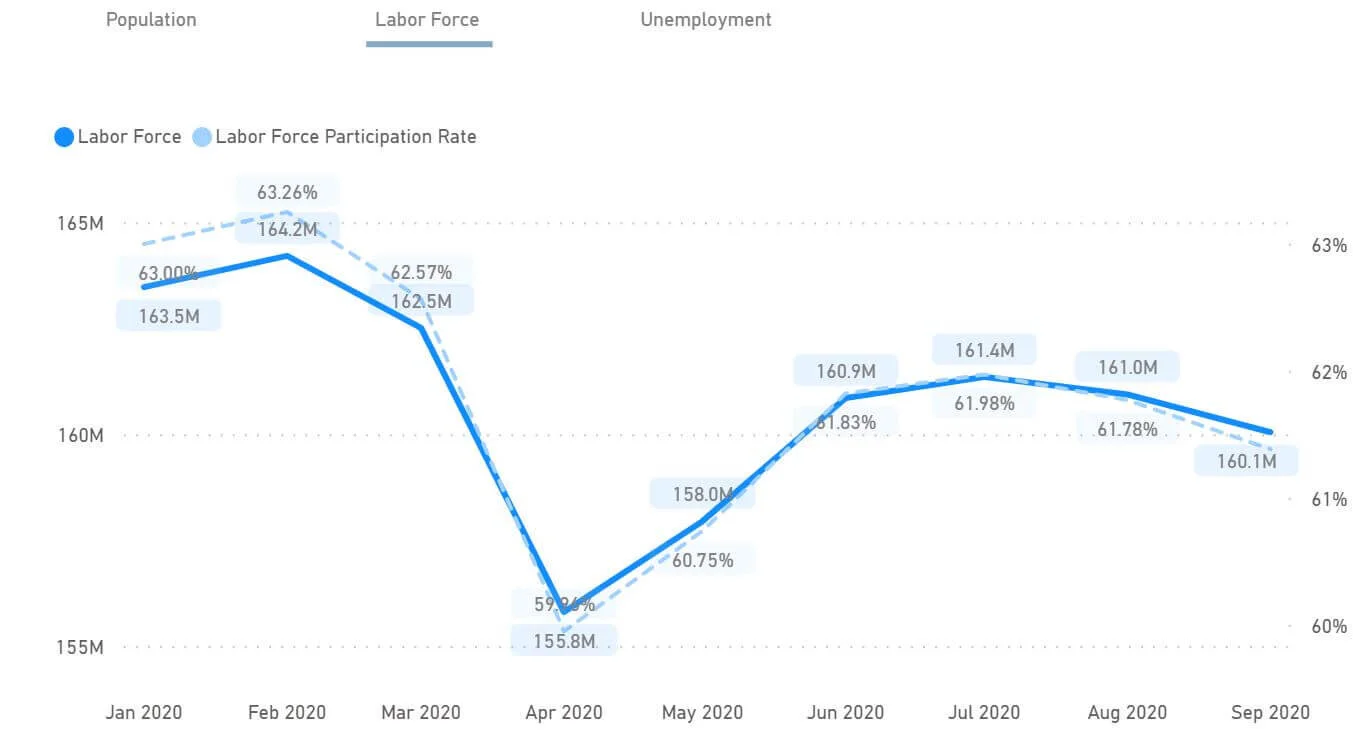
In February 2020, the labor force peaked at 164.2 million. It fell as low as 155.8 million in April, a whopping 5.1% decrease. During peak stimulus season, it climbed back as high as 161.4M. Then it dropped significantly. August to September saw a 900K decrease in labor for participants.
The total labor force in September was still 2.5% lower than in February. The trend that unfolded in the Twin Cities was not unique. It’s happening in many cities around the country.
It is also interesting to note that not even during the great recession did the national labor participation rate (labor force/population) ever drop 60% below what it was in April 2020.

Census.gov
I also spend a good amount of time on the census.gov website. The Census website is excellent for population metrics. BLS has population data at the state level. Census.gov will allow you to dive much deeper into city-specific population trends such as:
Annual growth rates
Percentage of population by age group
Growth rates by age group
Percentage of population by educational attainment (high school diploma, bachelor's degree, advanced degree, etc.)
Population by demographic groups (gender, ethnicity, and other population characteristics)
Household income statistics
The Quick Facts webpage is a great place to start your analysis. You can select multiple cities and compare them based on various characteristics. Below, I compare Washington, DC, Denver, and Minneapolis.
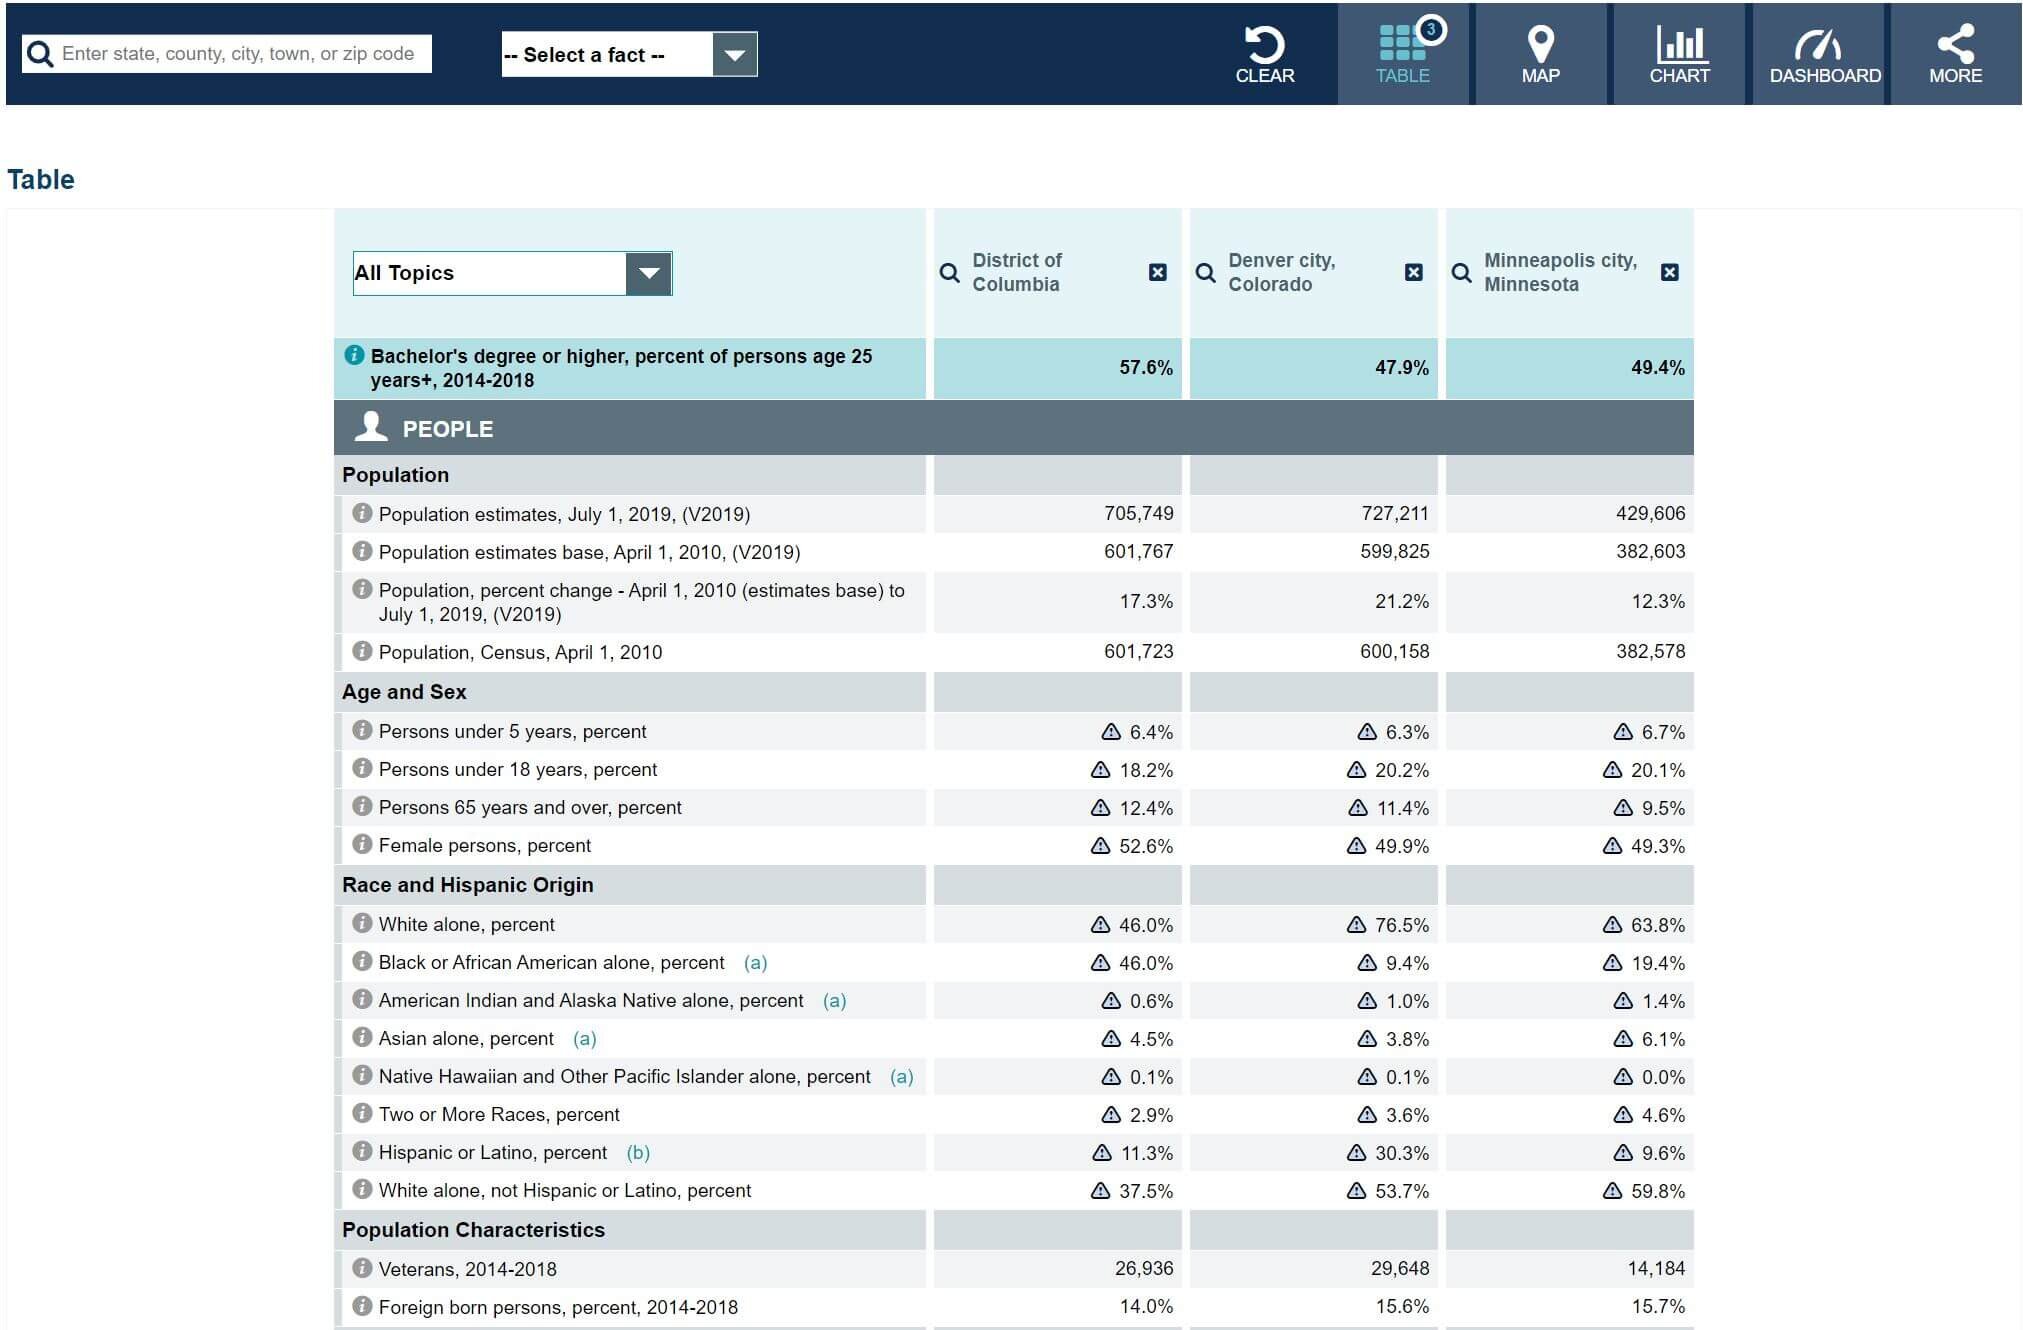
This dashboard has excellent surface-level demographic information that is easy to compare. However, much more information is below the image's frame.
You can look at time-series data for specific cities and see population trends. This data can be downloaded in Excel. It will be up to you to make calculations manually. I typically make a pivot table from this data and slice the information by age groups to see population trends for 24 -35-year-olds. I love to see a flux of young professionals migrating to a city. This indicates ample employment opportunities and typically correlates with strong rental fundamentals.
Summarizing Unemployment Tracking
The BLS and Census websites are great resources with vast quantities of economic information. You must understand the metrics they measure and investigate employment trends to fully understand the big picture. The national unemployment rate is meaningless on its own. It’s up to you to explore further; hopefully, this blog post will give you a few ideas about where to start your research.
Other Related Content: Submarket Research Free Download