Labor Statistics in the United States
A paramount part of commercial real estate investment is studying states, counties, and cities around the country to see if they are ripe for real estate investment. A crucial aspect of this analysis is analyzing economic data such as:
Population
Gross Employment
Gross Unemployment
Labor Force Population
Labor Force Participation Rate
Employee Participation Rate
Unemployment Rate
Gross Median Wage
Median Wage & Employees by Occupation
My go-to resource for this data is the U.S. Bureau of Labor Statistics (BLS), a unit that falls under the Department of Labor and tracks major employment trends in the U.S. The bls.gov website has vast information, but finding exactly what you are looking for can be tedious.
Labor Statistics
The purpose of this article is to let you know what information is available and what is not. Spending five minutes reading this article is well worth the investment. I have spent countless hours perusing labor market data to realize that what I want isn't even available. Hopefully, this article can save you some time and make your employment statistics research more streamlined.
Let's define the bullets above and determine if BLS will be a good resource for the data.
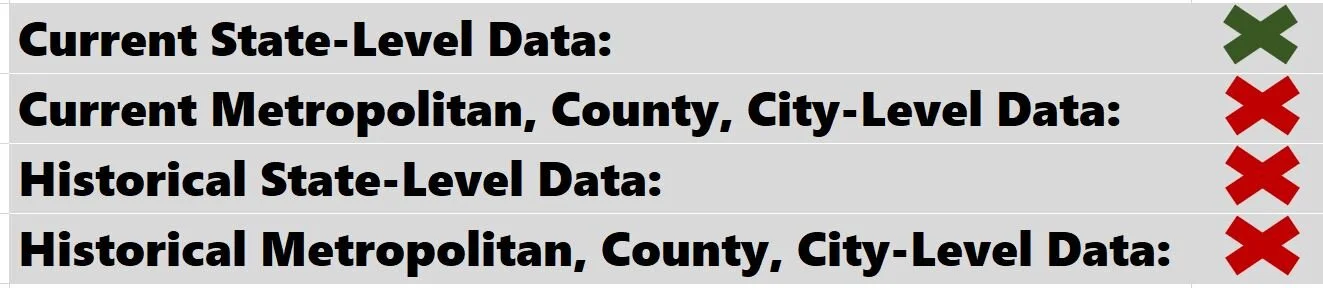
Population
Definition: Non-institutionalized citizens 16 years and older.
Population trends can be obtained at the state level on BLS. You are in the right spot if you need Minnesota, California, or New York population trends. However, you cannot drill down any further. You must look elsewhere for Minneapolis, San Francisco, or New York City population trends.
This state data can be reviewed on a historical basis as well.
The census.gov website is best for current population surveys and state-to-state migration trends.
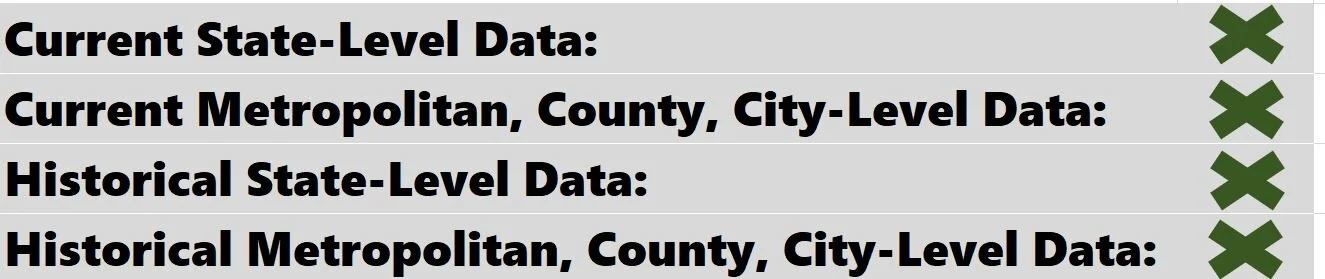
Gross Employment
Definition: All employees and self-employed individuals.
You can distinguish between all employees and non-farm employees and get more granular into the individual occupations such as manufacturing, business professional, and education.
You can review this data at the state and a more specific local area level, such as metropolitan area, county, and city. For example, you can see:
Total gross employment in MN
Total gross employment for non-farm only in MN
Total gross employment for non-farm only in St. Cloud, MN
Total gross employment for the educational occupation in St. Cloud, MN
The state and local area data can also be reviewed on a historical basis. Gross employment undoubtedly provides the most depth of data compared to the other metrics listed above.

Gross Unemployment
Definition: Individuals older than 16 are actively looking for employment.
You can review this data both at the state and local area levels. For example, you can see:
Total gross unemployment in AZ
Total gross unemployment in Phoenix, AZ
The state and local area data can also be reviewed on a historical basis.
Labor Force Population
Definition: Gross Employees + Gross Unemployed
Labor force populations can be obtained in the state and local areas. This could be incredibly helpful if you are researching small towns where data tends to be limited.
The state and local area data can also be reviewed on a historical basis.

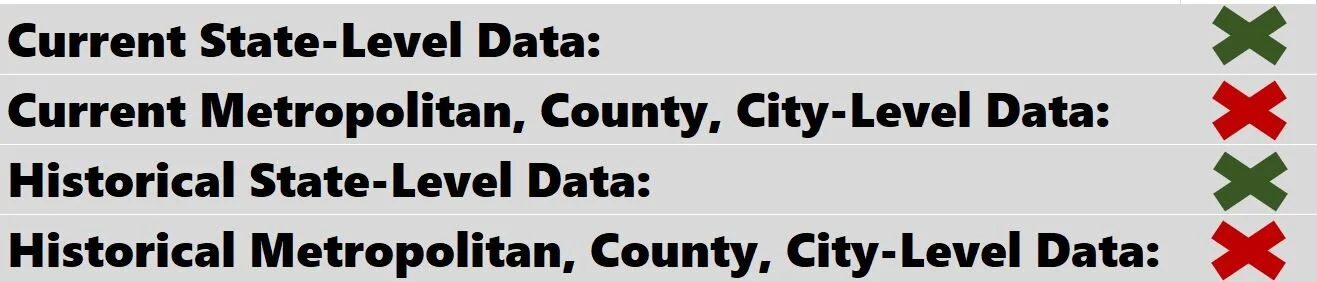
Labor Force Participation Rate
Definition: Labor Force Population / Population
As of August 2020, the U.S. labor force participation rate was 61.76%. This data is available at the state level but does not drill down further. For example, Colorado has a 66.99% labor participation rate above the national average. You won't be able to pull this data for Denver or any other metropolitan area, county, or city.
This state data can be reviewed on a historical basis as well.
Employee Participation Rate
Definition: Gross Employed / Population
As of August 2020, the U.S. employee participation rate was 56.5%. This data is available at the state level but does not drill down further. For example, in 2020, Florida averaged a 52.27% employee participation rate, well below the August national average. You won't be able to pull this data for Orlando, Dade County, or the Tallahassee MSA.
This state data can be reviewed on a historical basis as well.

Unemployment Rate
Definition: Gross Unemployed / Labor Force Population
Unemployment statistics are widely available outside the BLS website but can also be found here.
You can review this data both at the state and local area levels. For example, you can see:
Total gross unemployment in AZ
Total gross unemployment in Phoenix, AZ
The state and local area data can also be reviewed on a historical basis.

Gross Median Wage
You can find wage information by occupation at the state level. There is no historical wage information, and a sizeable lag will always exist between the current date and the most recent wage estimates. The current lag is about 1.5 years.
You could compare the Median Wage of Oklahoma vs. Kansas but couldn't do so for Oklahoma City vs. Topeka. BLS only uploads the current data.

Median Wages & Employees By Occupation
Finally, BLS also provides data on specific occupations at the national and state level. Unfortunately, this data is not available at the local area level.
You could compare the median wage of an accountant in Idaho vs. an accountant in Alabama. You can also see the gross employment (# of employees) by occupation to compare the number of accountant employees in Idaho vs. Alabama.
This information helps see the composition of jobs in states. I like to see states with a larger composition of computer/technological-related fields vs. more archaic occupations at risk of being automated. Like gross median wage income, the website has no historical data.

BLS Summary
Hopefully, this article gives you a more profound context on what to expect from the bls.gov website. It's a wealth of information, and knowing what is available on the front end should save you valuable time and effort when you begin your research.