The 20 Metros Attracting the Most 25-to-34-Year-Olds
The 25-to-34 age cohort represents the core renter demographic in America. This analysis ranks 164 metros by one-year growth in this age group using Census Bureau ACS data. Lincoln, Nebraska, leads the nation at +11.1%, followed by South Bend (+9.7%) and Crestview-Fort Walton Beach (+9.0%). We also cross-reference young adult growth with educational attainment to identify the metros attracting college-educated renters, a higher-quality demand signal for multifamily operators. The list is geographically diverse: the Sun Belt claims eight entries, but the Midwest and Northeast combine for eight more.
Why This Age Group Drives Apartment Demand
If you want to know where apartment demand is going, follow the 25-to-34-year-olds. This age cohort represents the core renter demographic. They are in their prime household-formation years, and the overwhelming majority are renters rather than homeowners. When a metro gains thousands of 25-to-34-year-olds, it means more lease signings, more demand for Class A and Class B apartments, and stronger rent growth down the road.
We pulled one-year growth rates in the 25-to-34 population from the Census Bureau's American Community Survey across 164 ranked metros. The average share of the population in this cohort is 13.6% nationally. Of the 164 metros tracked, 120 are gaining young adults.
The 20 Metros Gaining Young Adults Fastest
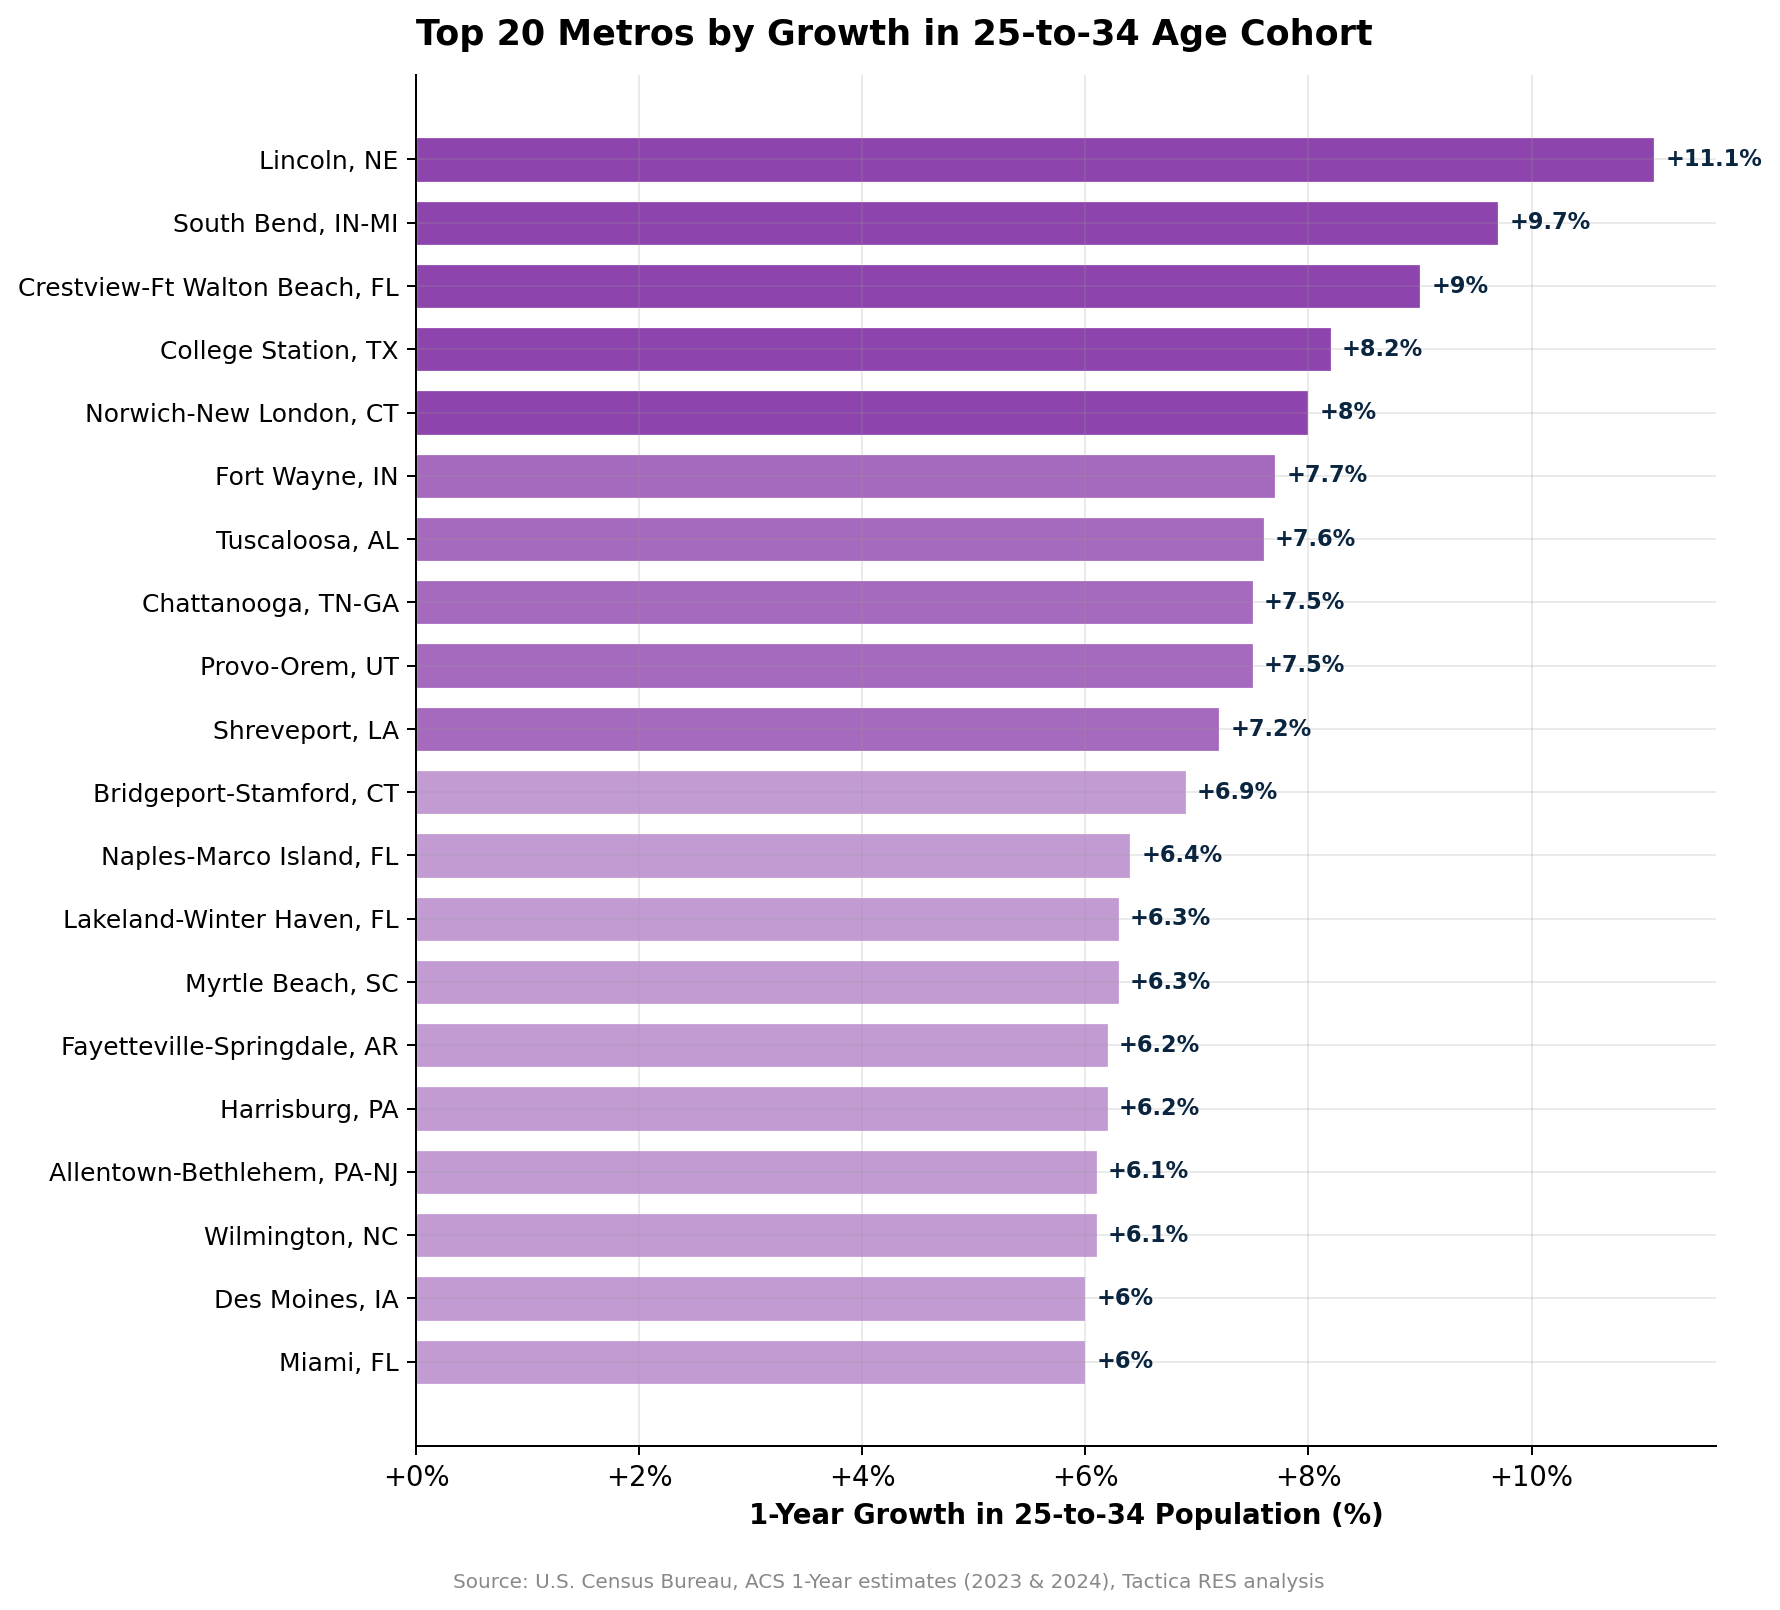
Lincoln, Nebraska, leads the nation at +11.1% growth in the 25-34 cohort. Lincoln combines a major university pipeline (the University of Nebraska), a 2.8% unemployment rate, a $1,112 median rent, and a 43.9% bachelor's degree rate. It is the kind of market that young professionals can actually afford, and they are voting with their feet.
The list is notably diverse geographically. The Sun Belt claims eight entries, but the Midwest takes four (Lincoln, South Bend, Des Moines, Fort Wayne), the Northeast takes four (Norwich, CT, Bridgeport-Stamford, Harrisburg, Allentown), and the Mountain West adds one (Provo). This is not a simple Sun Belt migration story. It is a broader reshuffling toward metros that offer some combination of affordability, employment, and quality of life.
Education Levels Tell a Deeper Story
Not all young adult migration is equal from a multifamily investment perspective. Markets attracting college-educated young adults tend to see stronger rent growth, lower turnover, and better credit quality among tenants. We cross-referenced 25-34 growth with the percentage of residents holding a bachelor's degree or higher.
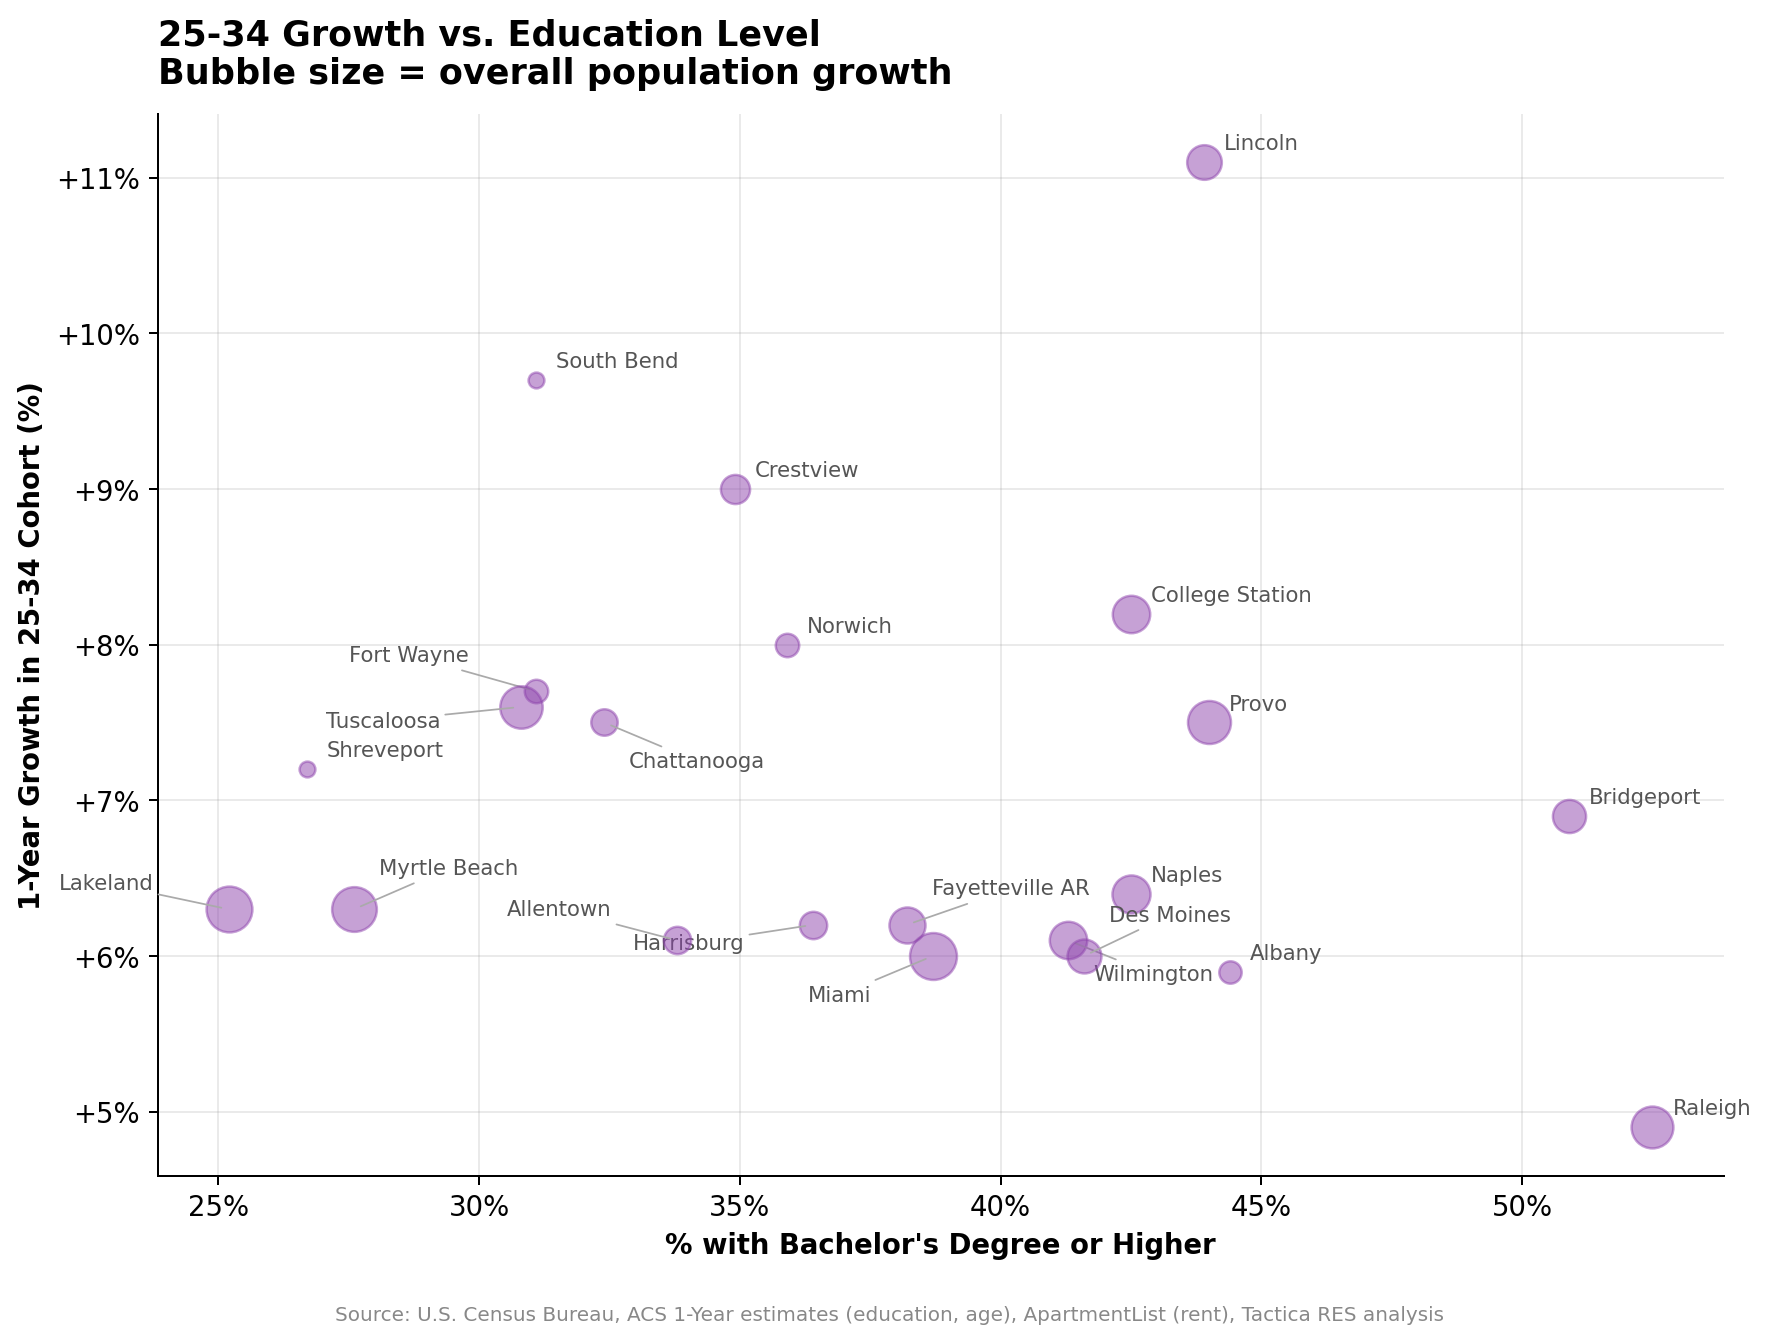
The upper-right quadrant, where high young-adult growth meets high education, is where the most compelling demand story lives. Provo-Orem (44% bachelor's, +7.5% young adult growth, +3.7% pop growth) is the standout. Raleigh-Cary (52.5% bachelor's, +4.9% young adult growth) and Des Moines (41.6% bachelor's, +6.0% young adult growth) also land firmly in this zone.
Markets in the upper-left quadrant (high young-adult growth but lower education levels) tell a different story. Myrtle Beach (27.6% bachelor's), Lakeland (25.2%), and South Bend (31.1%) are attracting young adults who may be more price-sensitive and more likely to rent by necessity rather than choice. These markets can still support multifamily investment, but the tenant profile skews toward Class B/C product.
Where Young Adults Are Leaving
The metros losing the 25-34 cohort deserve attention, too. Asheville, NC, leads the decline at -7.3%, which is striking given that its overall population grew 1.2%. Asheville is losing its prime renter demographic while gaining retirees and remote workers in other age brackets, a dynamic that reshapes the housing demand the market generates. Roanoke, VA (-7.0%), Savannah, GA (-4.7%), and Bremerton, WA (-4.4%) round out the steepest declines.
For multifamily investors, a market that is growing in total population but shrinking in the 25-34 cohort is a red flag for apartment demand. These markets may perform well for single-family rentals or age-restricted communities, but the traditional multifamily thesis weakens as the core renter demographic leaves. As the vacancy analysis shows, Asheville and Savannah both rank among the highest-vacancy metros in the country, and shrinking young-adult populations are part of the reason.
Full Rankings: Top 20 Metros for Young Adult Growth
| # | Metro | 25-34 1Y | % 25-34 | Bach % | Pop 1Y | Rent |
|---|---|---|---|---|---|---|
| 1 | Lincoln, NE | +11.1% | 13.8% | 43.9% | +2.4% | $1,112 |
| 2 | South Bend, IN-MI | +9.7% | 13.2% | 31.1% | +0.2% | $1,146 |
| 3 | Crestview-Ft Walton Beach, FL | +9.0% | 14.3% | 34.9% | +1.7% | $1,279 |
| 4 | College Station, TX | +8.2% | 13.8% | 42.5% | +2.8% | $1,277 |
| 5 | Norwich-New London, CT | +8.0% | 13.4% | 35.9% | +1.1% | $1,538 |
| 6 | Fort Wayne, IN | +7.7% | 14.0% | 31.1% | +1.1% | $1,081 |
| 7 | Tuscaloosa, AL | +7.6% | 13.0% | 30.8% | +3.6% | $1,129 |
| 8 | Chattanooga, TN-GA | +7.5% | 14.0% | 32.4% | +1.4% | $1,095 |
| 9 | Provo-Orem, UT | +7.5% | 16.2% | 44.0% | +3.7% | $1,286 |
| 10 | Shreveport, LA | +7.2% | 13.1% | 26.7% | 0.0% | $1,116 |
| 11 | Bridgeport-Stamford, CT | +6.9% | 12.1% | 50.9% | +2.2% | $2,128 |
| 12 | Naples-Marco Island, FL | +6.4% | 8.7% | 42.5% | +2.9% | $1,578 |
| 13 | Lakeland-Winter Haven, FL | +6.3% | 13.6% | 25.2% | +4.2% | $1,182 |
| 14 | Myrtle Beach, SC-NC | +6.3% | 9.9% | 27.6% | +4.0% | $1,119 |
| 15 | Fayetteville-Springdale, AR | +6.2% | 14.7% | 38.2% | +2.6% | $1,148 |
| 16 | Harrisburg-Carlisle, PA | +6.2% | 13.1% | 36.4% | +1.5% | $1,279 |
| 17 | Allentown-Bethlehem, PA-NJ | +6.1% | 12.4% | 33.8% | +1.5% | $1,407 |
| 18 | Wilmington, NC | +6.1% | 11.8% | 41.3% | +2.8% | $1,261 |
| 19 | Des Moines, IA | +6.0% | 14.5% | 41.6% | +2.3% | $1,137 |
| 20 | Miami, FL | +6.0% | 12.8% | 38.7% | +4.4% | $1,795 |
Disclaimer: Data sourced from ApartmentList (rent estimates, vacancy), the U.S. Bureau of Labor Statistics (employment, labor force), and the U.S. Census Bureau (population, demographics, housing). These agencies cannot vouch for analyses derived from their data. Rankings reflect Tactica RES methodology and are for informational purposes only, not investment advice.