Vacancy Rates Just Hit Multi-Year Highs in These 25 Metros: The Supply Pipeline Behind It
National apartment vacancy reached 7.4% in early 2026, according to ApartmentList data. But the national average masks dramatic divergence. Eleven tracked metros now show vacancy rates above 9%, and five have crossed 10%. This analysis ranks the 25 highest-vacancy metros, measures how far each has deviated from its own five-year average, and maps the multifamily construction pipeline driving the glut. Florida, Texas, and Colorado metros dominate the list, with Savannah, GA, showing the largest vacancy surge relative to its own historical norm.
Why Vacancy Is the Bottom-Line Metric
For multifamily investors, vacancy flows directly to the bottom line. When vacancy surges 3 to 4 percentage points above the five-year average, as it has in several Sun Belt markets on this list, the impact on net operating income can be severe. Every empty unit is lost revenue, and concessions offered to fill those units further compress effective rents.
The 25 Highest-Vacancy Metros in America
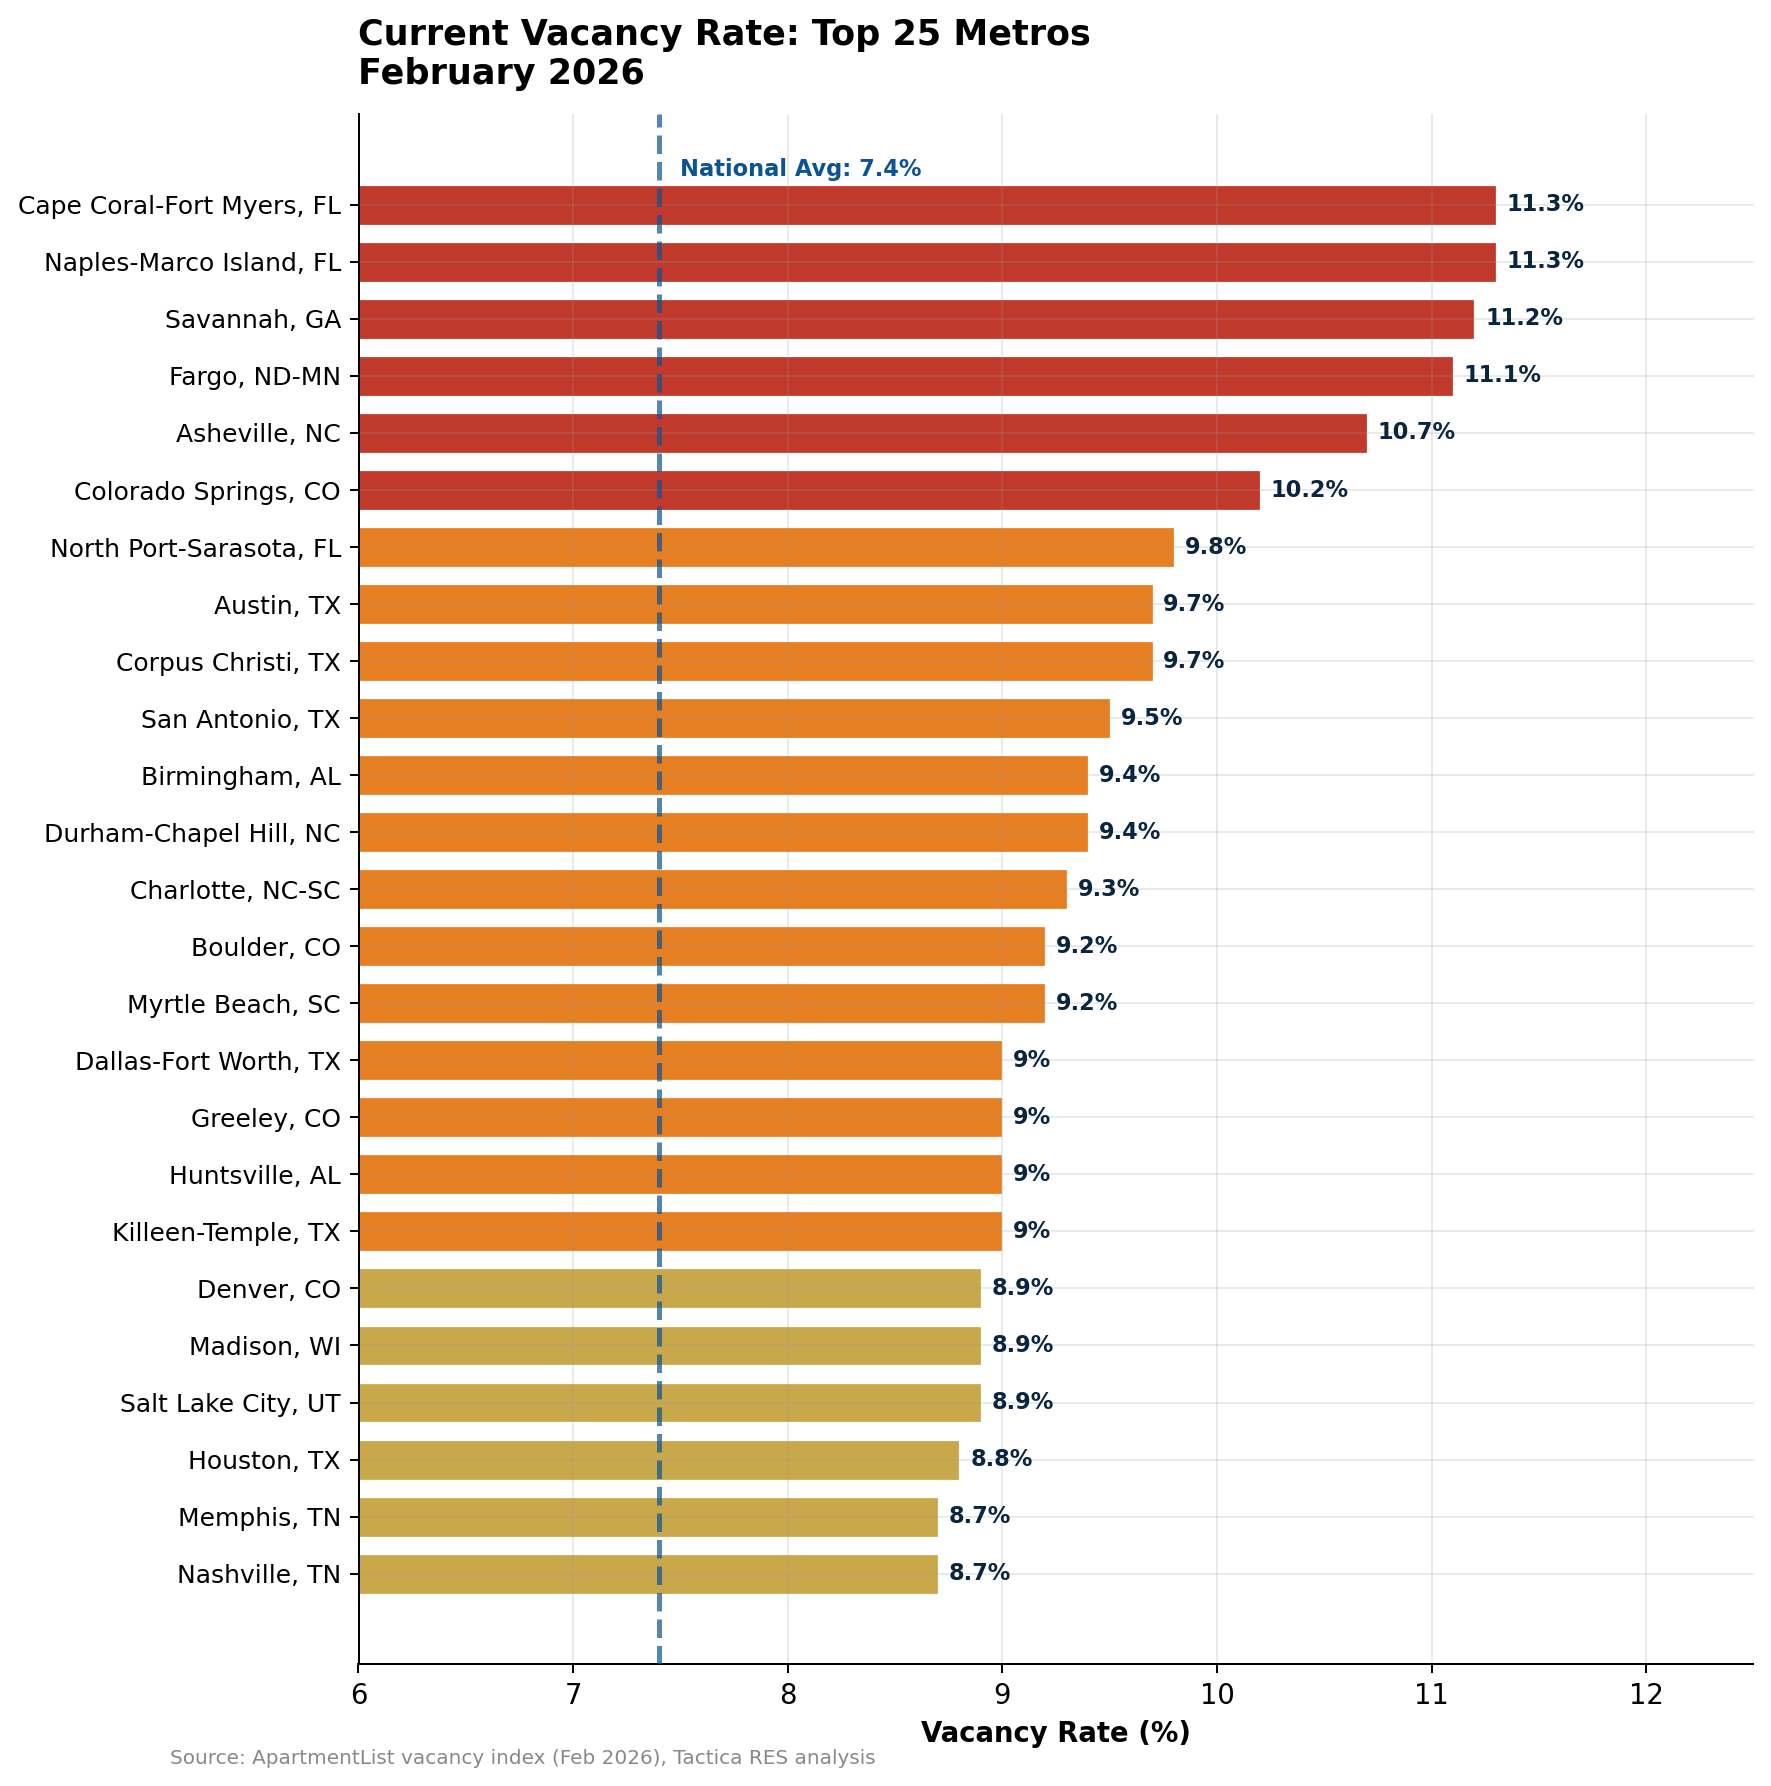
Four Florida metros claim spots in the top seven: Cape Coral and Naples (tied at 11.3%), North Port-Sarasota (9.8%), and further down, Tampa and Lakeland. Texas contributes five entries led by Austin (9.7%), San Antonio (9.5%), and Dallas-Fort Worth (9.0%). Colorado adds four: Colorado Springs (10.2%), Boulder (9.2%), Greeley (9.0%), and Denver (8.9%).
The geographic clustering is not random. These are the same states with the highest multifamily permitting rates in the dashboard data. The supply that was permitted during the 2021 to 2023 building boom is now delivering into a market where demand growth has normalized.
How Far Above Normal? The Vacancy Surge Index
Raw vacancy numbers alone do not tell the full story. A 9% vacancy rate in a market with a five-year average of 8.5% is very different from a 9% vacancy rate in a market that averaged 5%. The delta between current vacancy and the five-year average reveals which markets are most dislocated from their own norms.
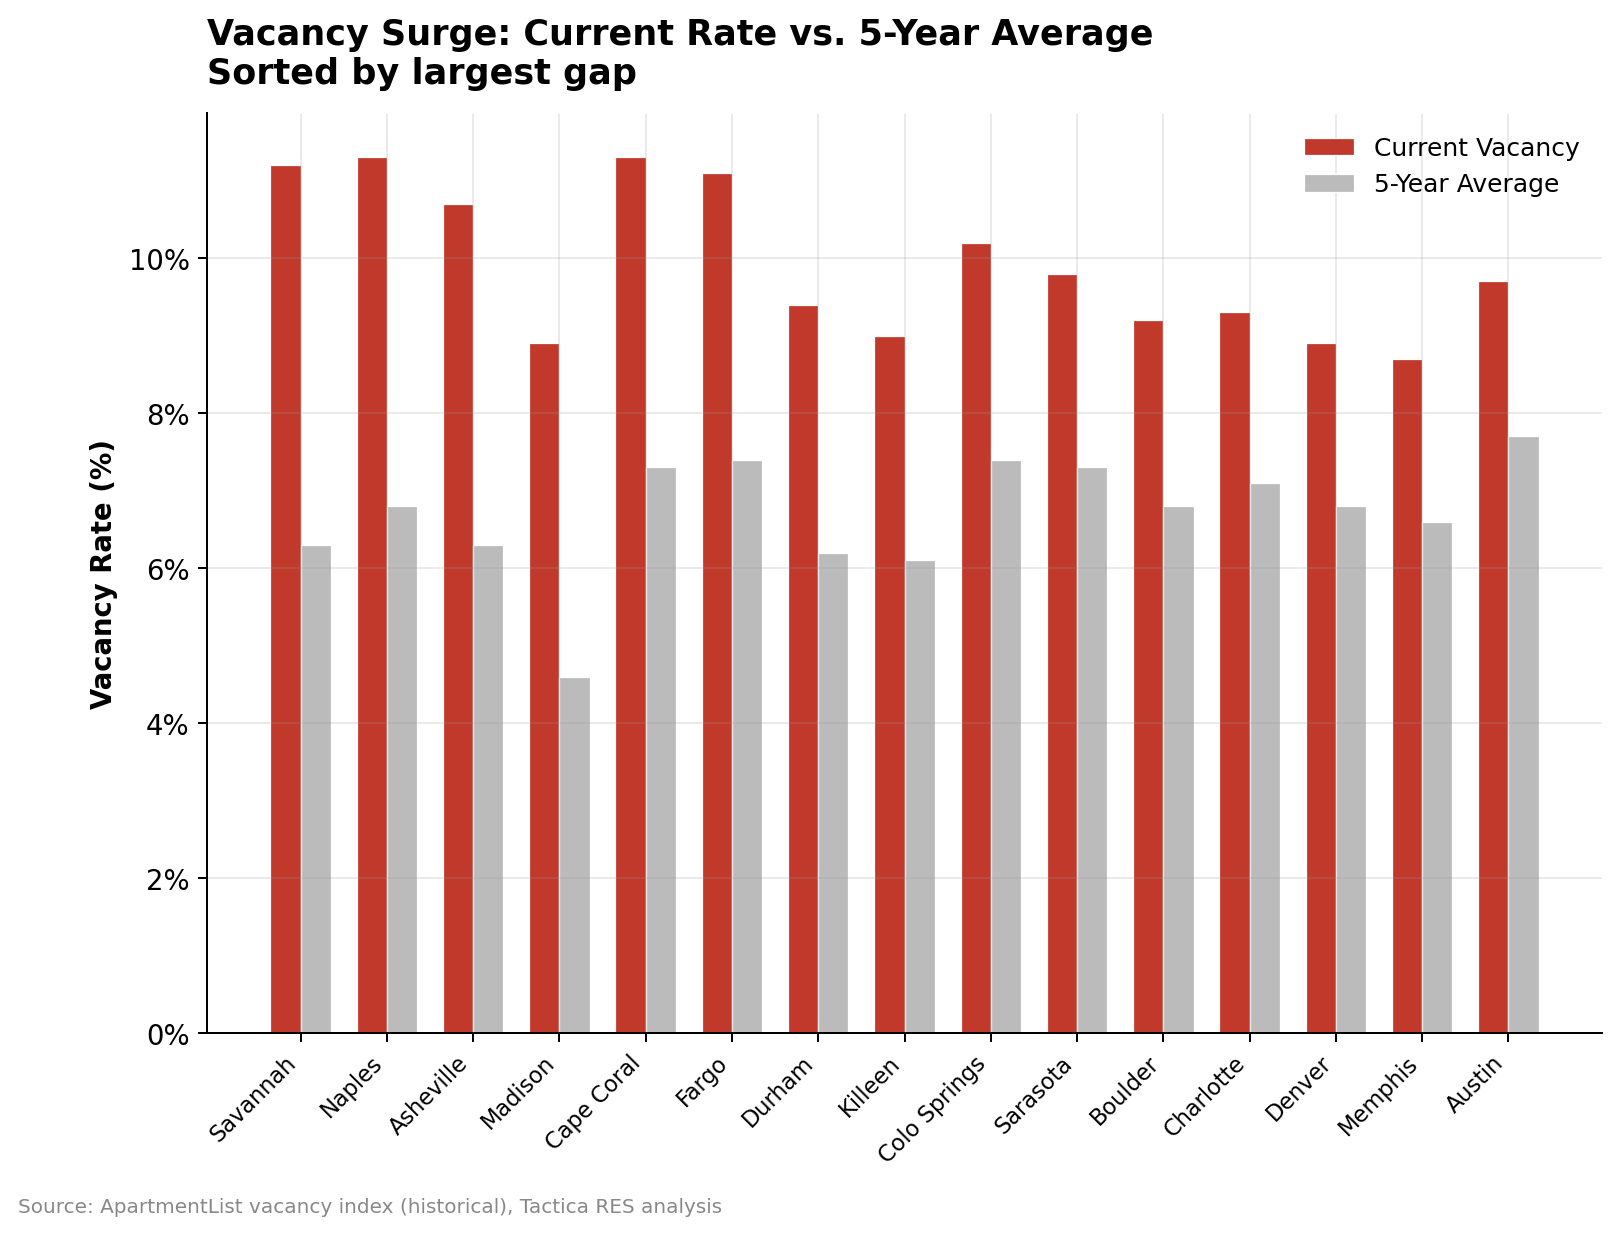
Savannah, GA, emerges as the most dislocated market relative to its own history. The current vacancy rate of 11.2% is 4.9 percentage points above its five-year average of 6.3%. Naples follows at +4.5 points above its norm, then Asheville at +4.4, Madison at +4.3, and Cape Coral at +4.0.
Corpus Christi (9.7% vacancy) is actually below its five-year average of 10.3%, meaning high vacancy there is normal, not a new phenomenon. These distinctions matter for underwriting: A market reverting toward its mean is a different investment case than a market breaking into unprecedented territory.
What's Driving the Vacancy Surge?
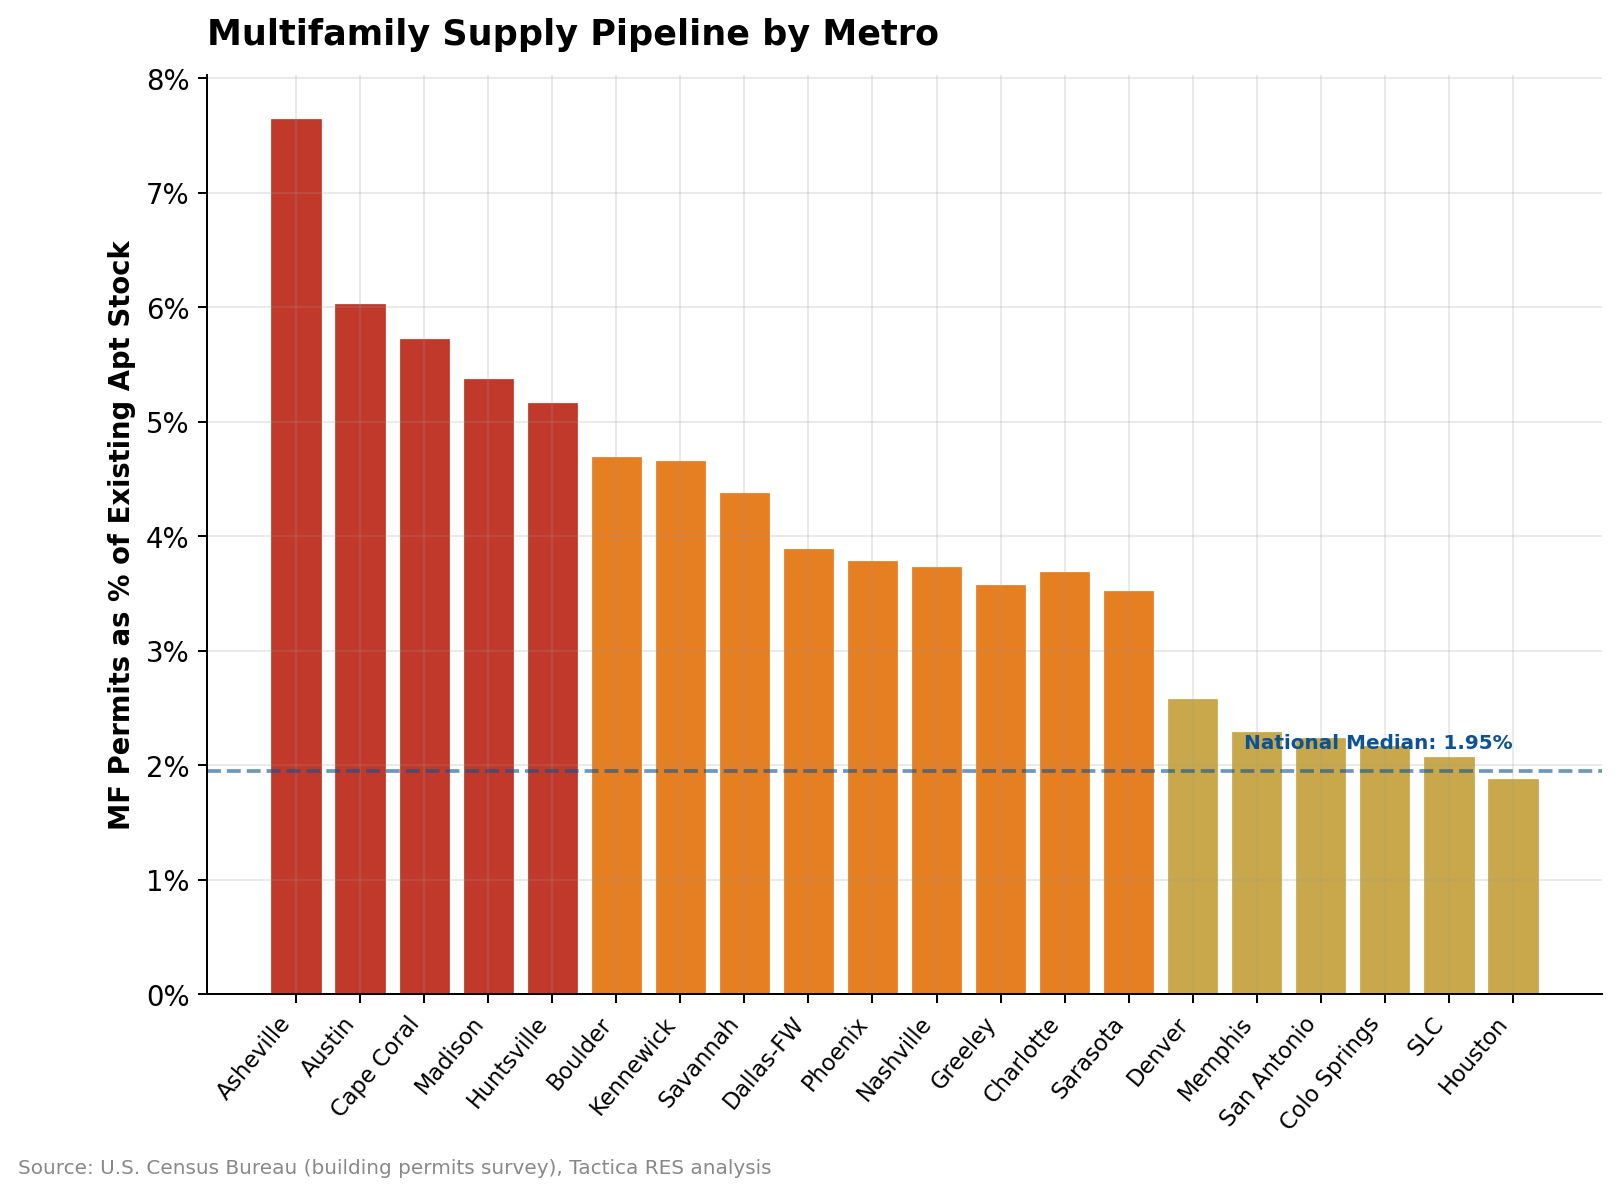
Asheville leads at 7.65%, meaning new permits equal nearly 8% of all existing apartments. At 7.65%, Asheville has an extraordinarily high ratio of new supply to existing stock, more than double the national median of 1.95%. Austin's 6.04%, Cape Coral's 5.73%, Huntsville's 5.17%, and Madison's 5.38% all tell similar stories.
The raw permit numbers in larger metros are staggering. Dallas-Fort Worth issued 23,150 multifamily permits; Austin, 15,126; and Houston, 11,505. Even with strong population growth, absorbing that volume takes time. As the analysis of rent declines across 25 metros documents, every one of these metros is currently posting negative year-over-year rent growth.
Note: The latest annual building permit data from the Census Bureau is from 2024. Permitted units typically take 18 to 30 months to deliver, so much of this supply has not yet hit the market.
The supply pipeline alone does not predict which markets will see the highest vacancy. Corpus Christi (9.7% vacancy) and Myrtle Beach (9.2%) both rank among the 15 highest-vacancy metros despite minimal new construction (supply ratios of 0.40% and 0.12%, respectively). Demand-side factors, not oversupply, drive their elevated vacancy. Birmingham (9.4% vacancy, 0.72% supply) tells a similar story. Conversely, some metros with aggressive permitting (Columbus, OH, at 7.43%, Omaha at 6.37%) have not yet cracked the high-vacancy list because strong absorption has kept pace. Investors cannot screen on permits alone and call it a day.
Where Vacancy Is Actually Tightening
Not every market is getting looser. Albany, NY, sits at just 3.6% vacancy, the lowest among all tracked metros, and is tightening, down from 5.2% three years ago. Portland, ME (3.7%), Providence (4.4%), and several Midwest markets are also running tight.
These low-vacancy metros are not investment targets by default, since some are low-vacancy because they are low-growth. But the ones that combine tight vacancy with strong affordability and employment growth represent supply-constrained fundamentals worth watching.
Full Rankings: 25 Highest-Vacancy Metros
| # | Metro | Vacancy | 5Y Avg | Delta | Supply % | Rent 1Y |
|---|---|---|---|---|---|---|
| 1 | Cape Coral-Fort Myers, FL | 11.3% | 7.3% | +4.0 | 5.73% | -9.1% |
| 2 | Naples-Marco Island, FL | 11.3% | 6.8% | +4.5 | 1.80% | -6.4% |
| 3 | Savannah, GA | 11.2% | 6.3% | +4.9 | 4.39% | -4.5% |
| 4 | Fargo, ND-MN | 11.1% | 7.4% | +3.7 | 1.66% | +6.2% |
| 5 | Asheville, NC | 10.7% | 6.3% | +4.4 | 7.65% | -3.1% |
| 6 | Colorado Springs, CO | 10.2% | 7.4% | +2.8 | 2.18% | -4.9% |
| 7 | North Port-Sarasota, FL | 9.8% | 7.3% | +2.5 | 3.53% | -8.0% |
| 8 | Austin, TX | 9.7% | 7.7% | +2.0 | 6.04% | -5.9% |
| 9 | Corpus Christi, TX | 9.7% | 10.3% | -0.6 | 0.40% | -2.1% |
| 10 | San Antonio, TX | 9.5% | 7.8% | +1.7 | 2.25% | -4.7% |
| 11 | Birmingham, AL | 9.4% | 7.4% | +2.0 | 0.72% | -0.1% |
| 12 | Durham-Chapel Hill, NC | 9.4% | 6.2% | +3.2 | 2.35% | -1.4% |
| 13 | Charlotte, NC-SC | 9.3% | 7.1% | +2.2 | 3.70% | -2.3% |
| 14 | Boulder, CO | 9.2% | 6.8% | +2.4 | 4.70% | -5.1% |
| 15 | Myrtle Beach, SC-NC | 9.2% | 7.5% | +1.7 | 0.12% | -2.8% |
| 16 | Dallas-Fort Worth, TX | 9.0% | 7.1% | +1.9 | 3.90% | -2.0% |
| 17 | Greeley, CO | 9.0% | 7.9% | +1.1 | 3.58% | -4.9% |
| 18 | Huntsville, AL | 9.0% | 7.6% | +1.4 | 5.17% | -3.5% |
| 19 | Killeen-Temple, TX | 9.0% | 6.1% | +2.9 | 1.06% | -1.7% |
| 20 | Denver, CO | 8.9% | 6.8% | +2.1 | 2.59% | -4.6% |
| 21 | Madison, WI | 8.9% | 4.6% | +4.3 | 5.38% | +0.1% |
| 22 | Salt Lake City, UT | 8.9% | 6.9% | +2.0 | 2.08% | -2.4% |
| 23 | Houston, TX | 8.8% | 7.2% | +1.6 | 1.89% | -1.9% |
| 24 | Memphis, TN-MS-AR | 8.7% | 6.6% | +2.1 | 2.30% | -1.4% |
| 25 | Nashville, TN | 8.7% | 6.7% | +2.0 | 3.74% | -2.2% |
Data sourced from ApartmentList (rent estimates, vacancy), the U.S. Bureau of Labor Statistics (employment, labor force), and the U.S. Census Bureau (population, demographics, housing). These agencies cannot vouch for analyses derived from their data. Rankings reflect Tactica RES methodology and are for informational purposes only, not investment advice.


The 25-to-34 age group drives apartment demand. We ranked 164 metros by growth in this cohort to map where productive renters are headed next.