The 25 U.S. Metros Where Rents Are Still Falling: What It Means for Multifamily Investors
National rents fell 1.5% year-over-year through February 2026, according to ApartmentList data, but the national figure masks a much wider divergence. Of the 165 major metros with sufficient data for ranking, 92 posted negative annual rent growth. This analysis ranks the 25 metros with the steepest year-over-year rent declines, cross-references each against vacancy rates, multifamily supply pipelines, and population growth data, and categorizes the results to help multifamily investors distinguish temporary corrections from structural problems.
Florida, Colorado, and Texas metros dominate the list, driven largely by elevated construction pipelines delivering into softening demand. For multifamily investors, this is not a blanket red flag. Some of these markets are correcting from pandemic-era spikes and may represent buying opportunities. Others are drowning in new supply with no absorption in sight. The difference matters enormously for underwriting.
The 25 Worst Markets for Rent Growth
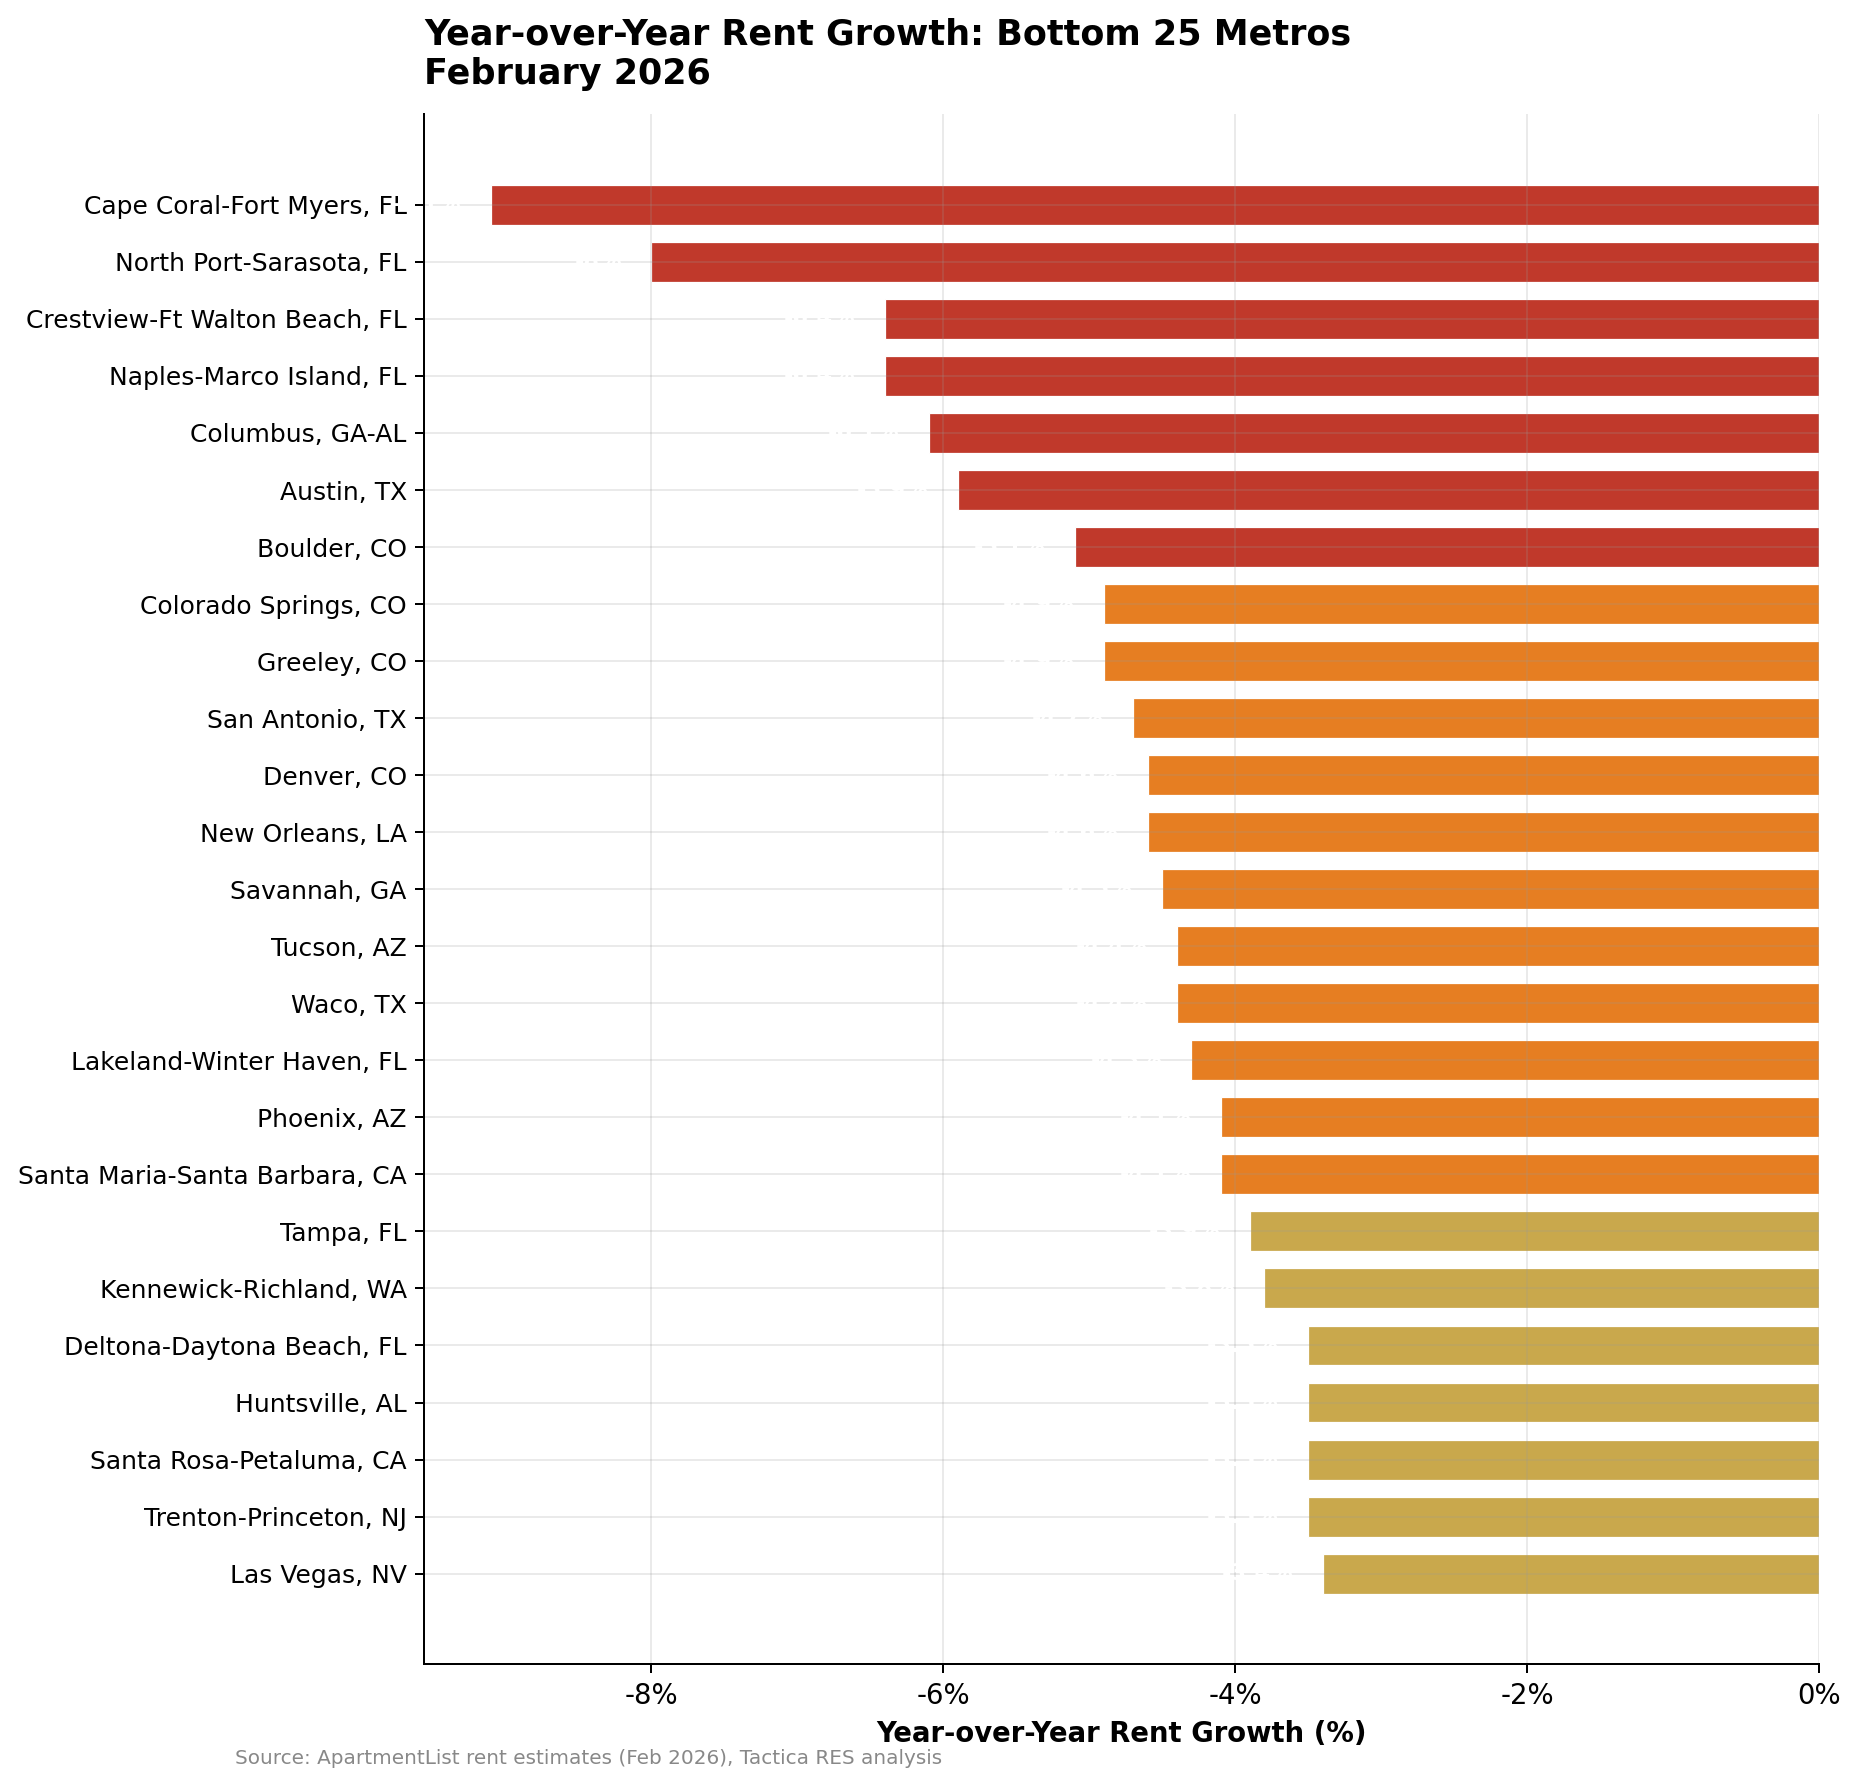
Florida dominates this list. Seven of the 25 worst-performing metros are in the Sunshine State, led by Cape Coral-Fort Myers at -9.1% and North Port-Sarasota at -8.0%.
Colorado claims four entries (Boulder, Colorado Springs, Greeley, and Denver), and Texas adds another three (Austin, San Antonio, and Waco).
The clustering is not coincidental. Florida and Texas both experienced massive pandemic-era migration booms that triggered aggressive construction pipelines. Those units are now being delivered into a market where migration has slowed, and existing residents face affordability ceilings.
The Supply Story Behind the Declines
Rent declines do not happen in a vacuum. Across the 20 declining metros for which vacancy data are available, there is a clear negative correlation (r = -0.64) between vacancy rates and rent performance. Higher vacancy means steeper rent declines.
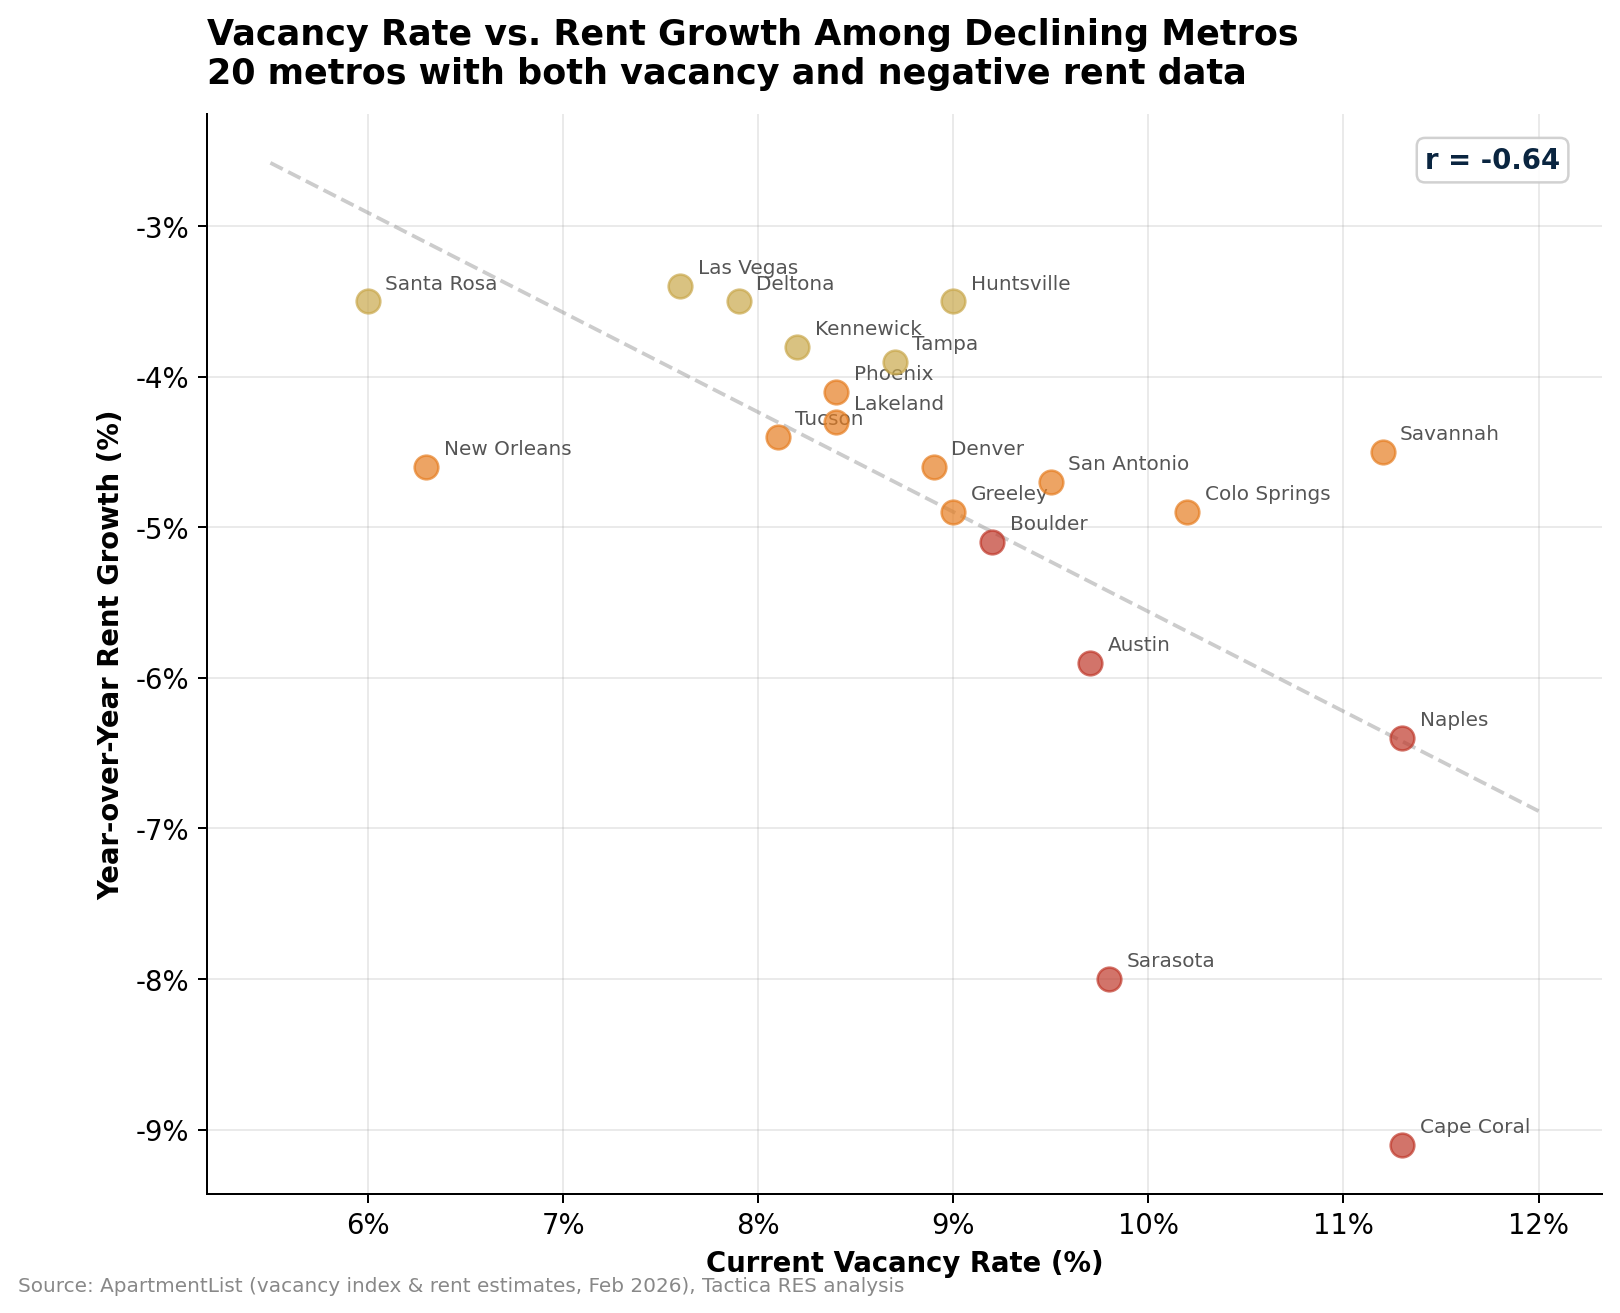
Cape Coral (11.3% vacancy, -9.1% rent growth) and Sarasota (9.8% vacancy, -8.0%) anchor the end of the trend line. Austin sits right where the data predicts: 9.7% vacancy and a -5.9% rent decline. The metros with more moderate vacancy rates (Las Vegas at 7.6%, Deltona at 7.9%) are seeing correspondingly milder declines in the -3% to -4% range.
The outlier worth noting is New Orleans. It is posting a steep -4.6% rent decline despite a relatively low 6.3% vacancy rate. That suggests a demand-side problem (population stagnation, weak job growth) rather than a supply glut, which carries a fundamentally different risk profile for multifamily investors watching vacancy trends.
A Correction, Not a Crash, For Most Markets
Even after these declines, most of these markets are still well above pre-pandemic rent levels on a five-year basis. Cape Coral rents are still up 12.6% over five years. North Port-Sarasota is up 20.1%. Savannah is up 28.2%. Tampa is up 23.9%.
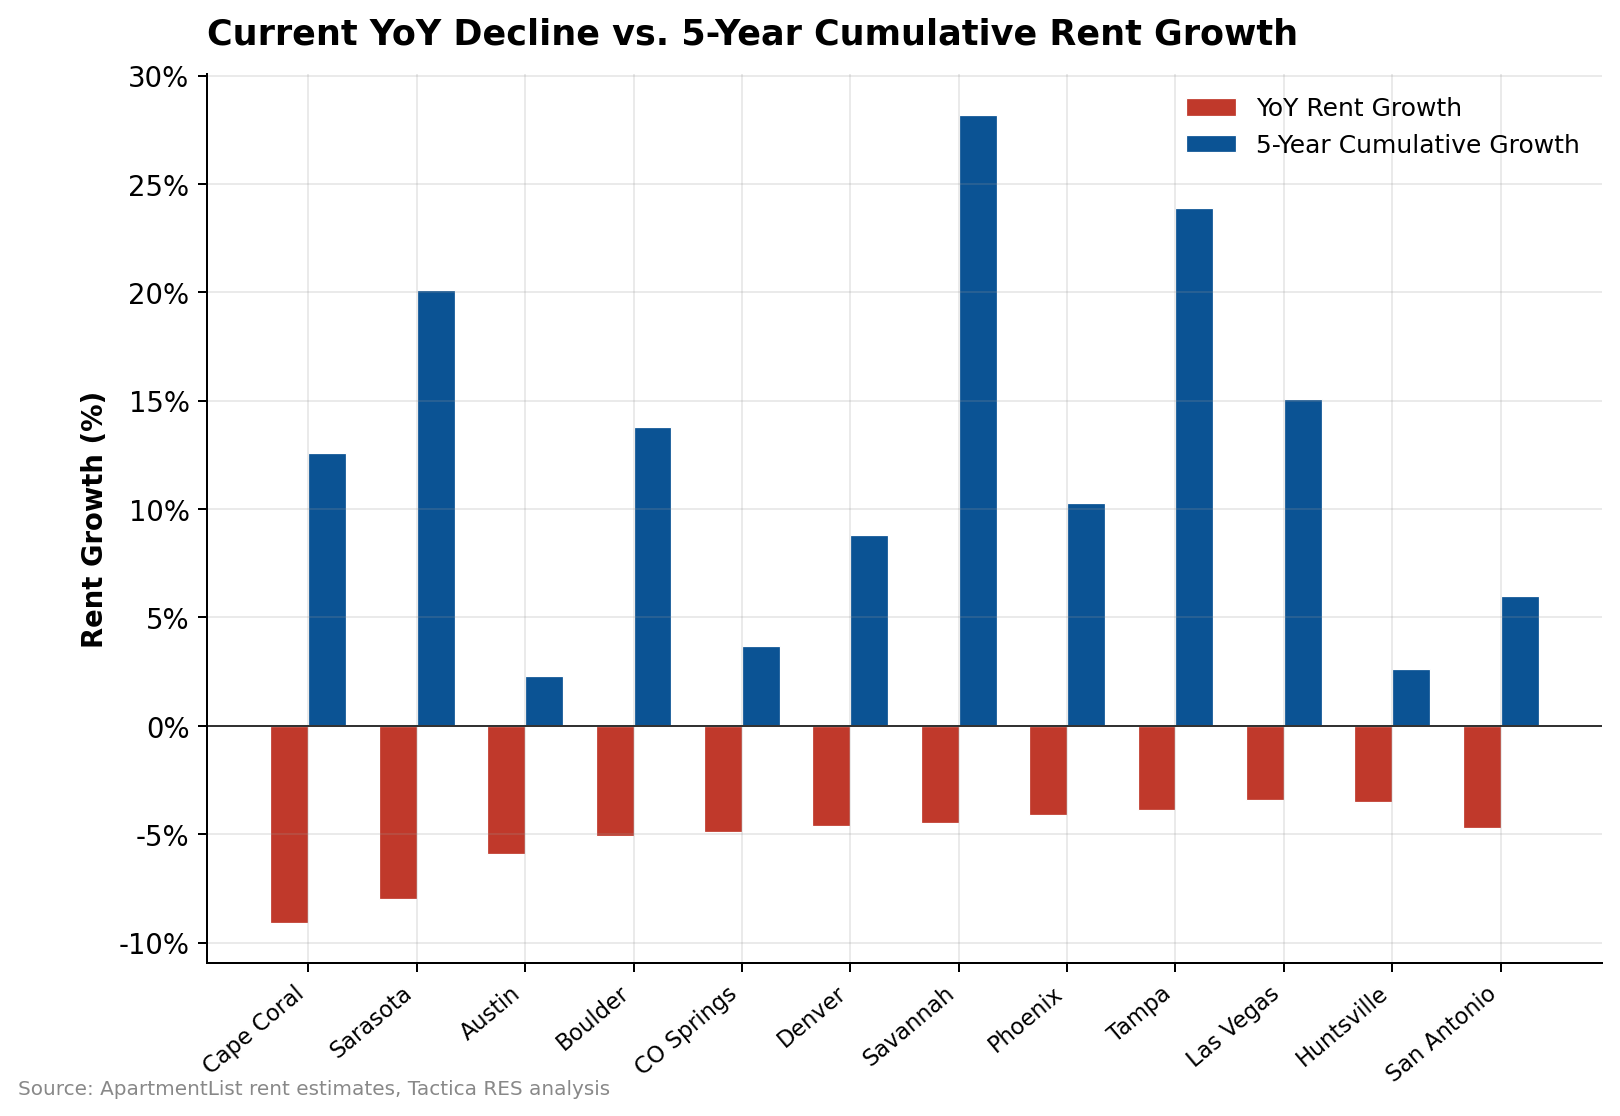
The markets that should concern investors most are those where current rents have nearly erased their five-year gains. Austin's five-year cumulative growth is just 2.3%, meaning that, after accounting for the current correction, rents have barely moved over the past half-decade. Colorado Springs sits at 3.7%. Huntsville is at 2.6%. These are the markets where the supply overshoot may have permanently reset the rent trajectory, and continued population growth will be necessary to absorb units in the upcoming years.
What Multifamily Investors Should Watch
The metros on this list fall into three categories, and each demands a different investment thesis:
For a deeper look at which of these markets are also still affordable relative to wages or attracting the 25-to-34-year-old renters that drive apartment demand, see the companion analyses.
Full Rankings: 25 Metros with the Steepest Rent Declines
| # | Metro | YoY Rent | Vacancy | Supply % | Pop 1Y | Med. Rent |
|---|---|---|---|---|---|---|
| 1 | Cape Coral-Fort Myers, FL | -9.1% | 11.3% | 5.73% | +3.2% | $1,267 |
| 2 | North Port-Sarasota, FL | -8.0% | 9.8% | 3.53% | +2.7% | $1,448 |
| 3 | Crestview-Ft Walton Beach, FL | -6.4% | — | 4.38% | +1.7% | $1,279 |
| 4 | Naples-Marco Island, FL | -6.4% | 11.3% | 1.80% | +2.9% | $1,578 |
| 5 | Columbus, GA-AL | -6.1% | — | 0.17% | -0.3% | $1,187 |
| 6 | Austin, TX | -5.9% | 9.7% | 6.04% | +3.1% | $1,273 |
| 7 | Boulder, CO | -5.1% | 9.2% | 4.70% | +1.0% | $1,733 |
| 8 | Colorado Springs, CO | -4.9% | 10.2% | 2.18% | +1.1% | $1,373 |
| 9 | Greeley, CO | -4.9% | 9.0% | 3.58% | +2.9% | $1,486 |
| 10 | San Antonio, TX | -4.7% | 9.5% | 2.25% | +2.2% | $1,154 |
| 11 | Denver, CO | -4.6% | 8.9% | 2.59% | +1.5% | $1,600 |
| 12 | New Orleans, LA | -4.6% | 6.3% | 0.50% | +0.4% | $1,149 |
| 13 | Savannah, GA | -4.5% | 11.2% | 4.39% | +1.6% | $1,420 |
| 14 | Tucson, AZ | -4.4% | 8.1% | 1.09% | +1.6% | $1,110 |
| 15 | Waco, TX | -4.4% | — | 1.17% | +0.1% | $1,041 |
| 16 | Lakeland-Winter Haven, FL | -4.3% | 8.4% | 2.13% | +4.2% | $1,182 |
| 17 | Phoenix, AZ | -4.1% | 8.4% | 3.79% | +2.3% | $1,343 |
| 18 | Santa Maria-Santa Barbara, CA | -4.1% | — | 1.15% | +0.7% | $1,940 |
| 19 | Tampa, FL | -3.9% | 8.7% | 2.23% | +2.4% | $1,464 |
| 20 | Kennewick-Richland, WA | -3.8% | 8.2% | 4.67% | +1.6% | $1,308 |
| 21 | Deltona-Daytona Beach, FL | -3.5% | 7.9% | 1.14% | +2.5% | $1,373 |
| 22 | Huntsville, AL | -3.5% | 9.0% | 5.17% | +2.9% | $1,000 |
| 23 | Santa Rosa-Petaluma, CA | -3.5% | 6.0% | 0.62% | +0.7% | $2,079 |
| 24 | Trenton-Princeton, NJ | -3.5% | — | 6.73% | +2.7% | $1,605 |
| 25 | Las Vegas, NV | -3.4% | 7.6% | 1.60% | +2.7% | $1,417 |
Disclaimer: Data sourced from ApartmentList (rent estimates, vacancy), the U.S. Bureau of Labor Statistics (employment, labor force), and the U.S. Census Bureau (population, demographics, housing). These agencies cannot vouch for analyses derived from their data. Rankings reflect Tactica RES's methodology and are for informational purposes only; they are not investment advice.


The 25-to-34 age group drives apartment demand. We ranked 164 metros by growth in this cohort to map where productive renters are headed next.