Investing in Rental Properties: An Analysis Tutorial
Most real estate investors spanning all asset classes will likely invest in residential rental properties at one point or another. I consider residential real estate to consist of:
Single-Family Homes
Duplexes
Triplexes
Fourplexes
While a 5-unit is technically no longer considered residential, it likely should be for financial modeling purposes.
Rental Property Investment Strategies
Images displayed in the post are from a property underwritten in the Tactica Residential Analysis Model.
This is the first article in a two-part series and will cover turnkey rental property analysis. Part #2 will cover using the Residential Analysis Model for fix/flip and flix/hold investment opportunities.
The model featured in this article is a paid tool; however, I also offer a free residential analysis template that you could use to vet an investment's potential quickly.
Pre-Analysis-Enabling Macros
Turnkey (Cash Flow Ready) Definition
Turnkey property, in its simplest form, is a rental property that will generate positive cash flow with little (if any) significant repairs or other deferred capital investment. The property doesn't need to be pristine by any measure; it needs to provide a functional living space that could be rented relatively easily.
I classify my first rental investment as a turnkey rental. It was a duplex that would also serve as my primary residence. I needed to fill the other unit with a renter ASAP. While the rental unit was far from impeccable, it was functional and in a phenomenal part of town. I immediately found tenants at a rental rate that was 50% greater than what the previous owner charged their tenants without sinking in any capital.
My first rental property was an excellent investment because I did so much research to vet the property and make sure it would provide a solid return on investment.
Turnkey Rental Property Analysis
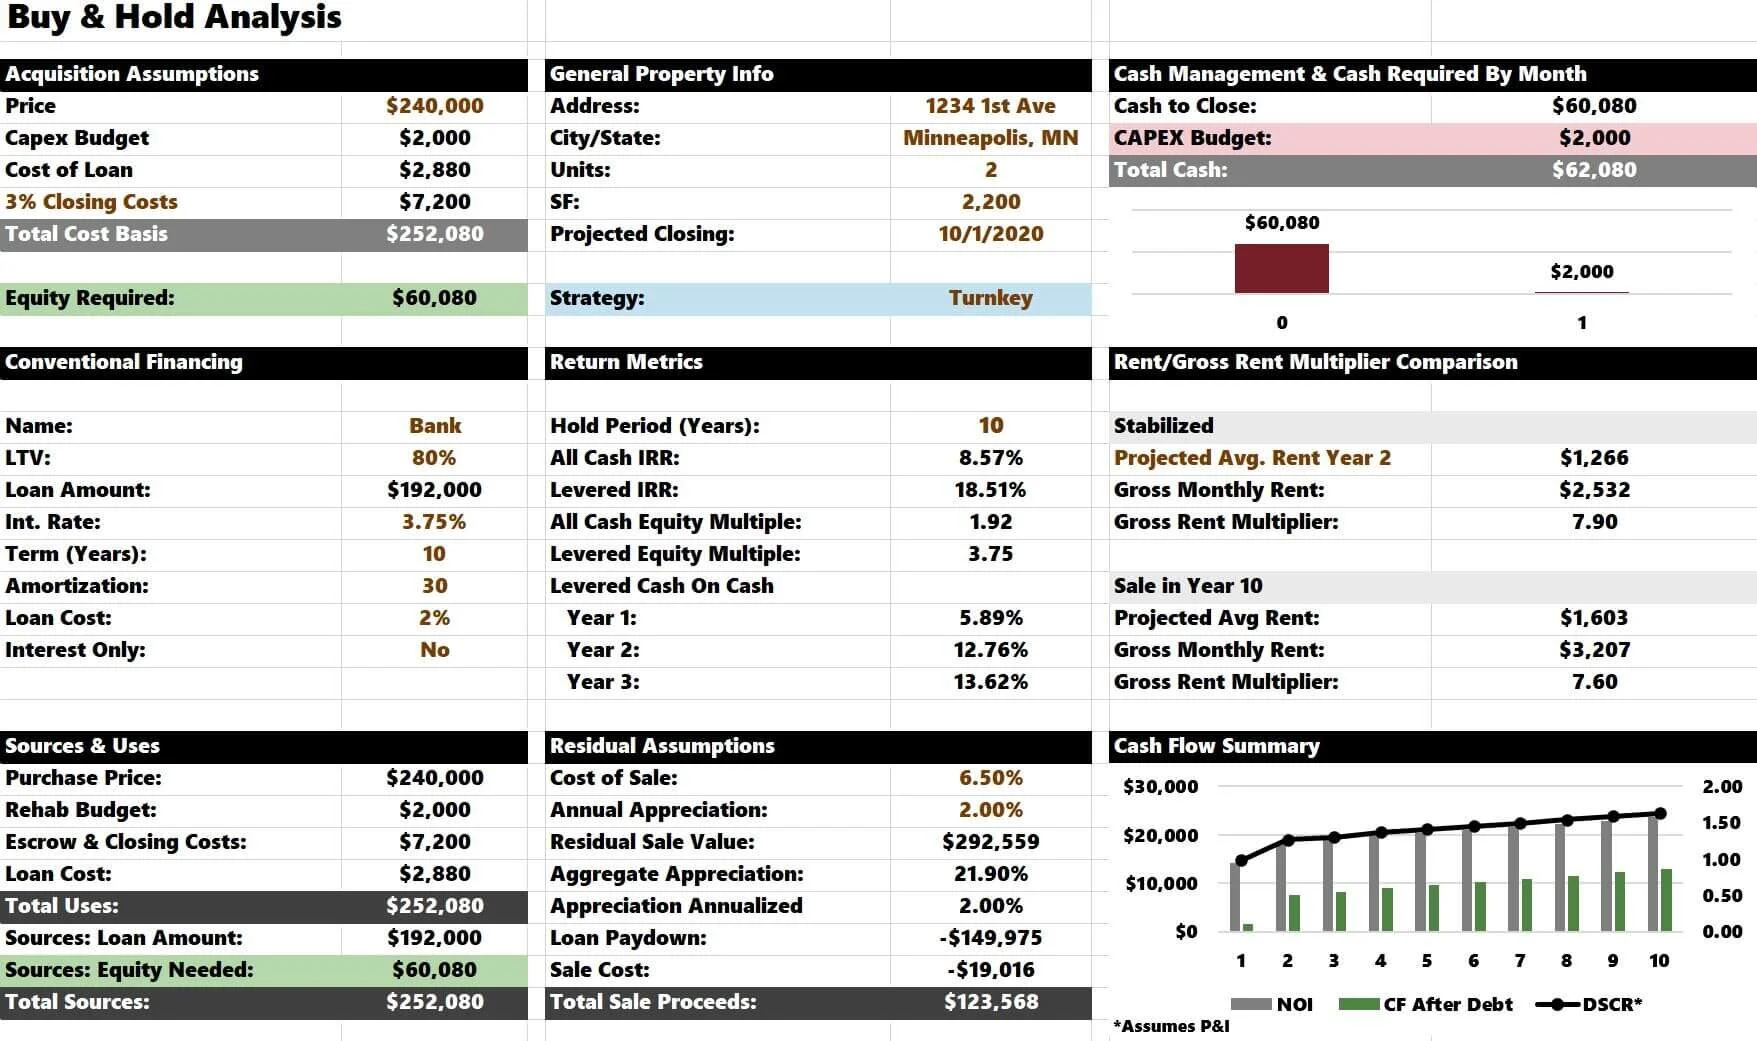
Investment Summary
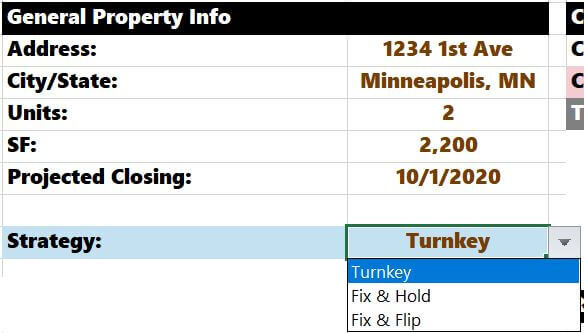
General Property Information
Firstly, you'll enter the general property information. None of this data will affect the cash flows in the model; it's strictly qualitative. Brown text cells are the cells that require inputs throughout the entire financial model.
This "case study" analysis is for the turnkey cash-flowing property. If this were a fix-and-flip analysis, you would change the investment strategy in this section via the drop-down menu.
Acquisition Assumptions
You will receive pricing guidance if you talk directly with a realtor or seller. The first analysis section of the model is dedicated to this.
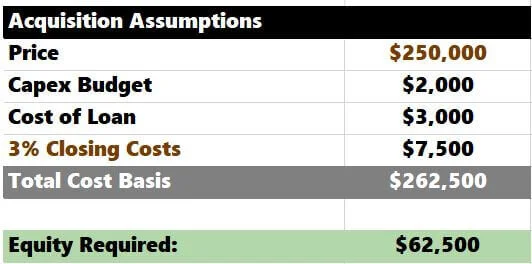
“Capex Budget” and “Cost of Loan” assumptions come from other areas of the model that I'll get into shortly. You must make a closing cost assumption (3% of the purchase price is a reasonable estimate).
Financing
The following section is financing.

It's self-explanatory; you'll enter all the pertinent mortgage information a lender provides. The "LTV" (entered as a percentage) will determine how much your cash down payment will equal. The interest rate and amortization will decide your monthly and annual mortgage payments. All of the debt info is summarized in detail on the "Conventional Debt" tab.
The loan cost from the previous section is stipulated in this section. I am using 1.5% of the total loan amount as my assumption.
Sources & Uses
The model should provide you with a summary of your sources and uses.
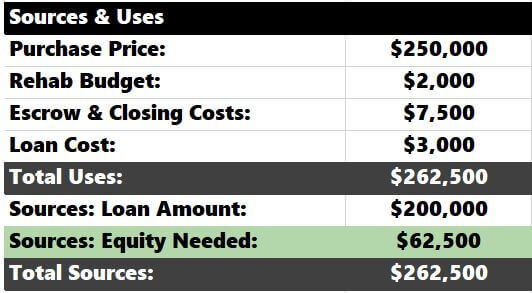
You can see a $2,000 rehab budget we haven't yet discussed. Most importantly, you can see how much cash is required to close the deal ($62,500).
Residual Assumptions
Appreciation is a great benefit of real estate investing. This section is where you make your “Annual Appreciation” assumption. You'll also estimate your future “Cost of Sale” (realtor fees, deed tax, legal, etc.)
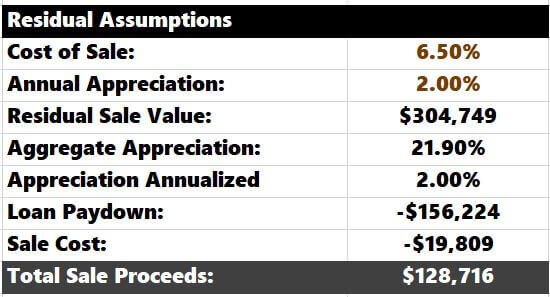
I am also conservative in this assumption. It’s easy to type in an aggressive annual assumption, making the deal look like a home run regardless of cash flow. I am using a modest 2% inflation assumption with a 6.5% cost of sale. Over a 10-year holding period, the residual sales value would increase to $304,749.
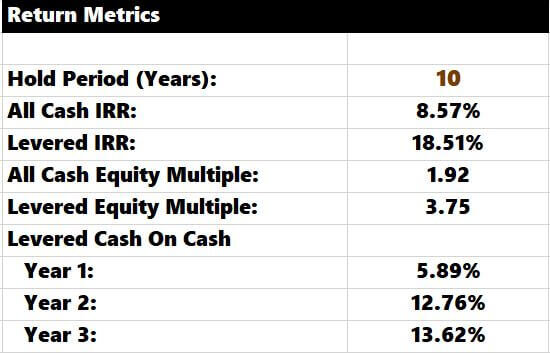
Return Metrics
Returns are also summarized in the principal investment tab. You can see various metrics listed in the middle of this worksheet. You'll notice the “Hold Period” is a brown text cell. You can adjust the hold period and see how it affects IRRs, equity multiples, and cash-on-cash returns.
Cash Management
The cash management section is far more beneficial when evaluating a rehab scenario. If you are looking at a turnkey property, there likely won't be a considerable need for serious CAPEX investment. The cash outflows will be summarized nicely in the bar graph below if you have planned capital spending for your rental property investment.
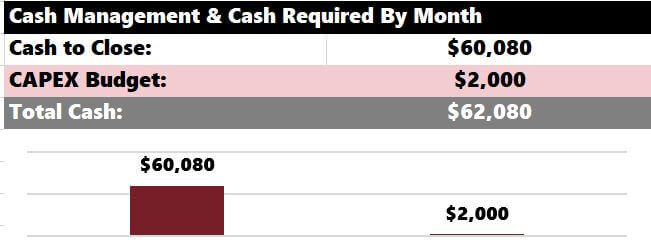
It's important to remember that running a "Turnkey" analysis assumes you pay all CAPEX out of pocket (not borrowed).
Rent Multiplier Comparison
This section is a safety check of sorts. It's a way to ensure you are not too aggressive with your residual sales assumption.
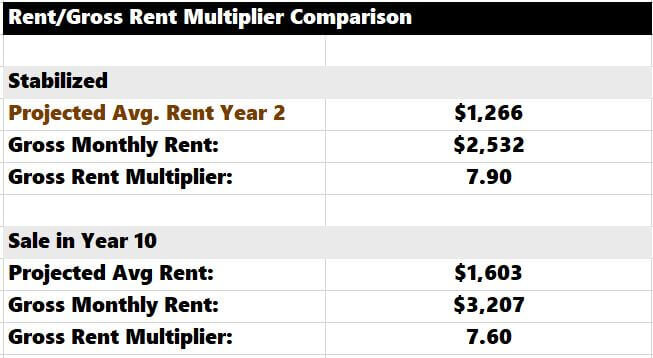
GRM = Price / Gross Monthly Rent
A higher GRM will typically indicate less cash flow but more appreciation upside. Conversely, a low GRM will mean increased cash flow with less appreciation upside. Ideally, you'd like to find a property in a real estate market that will exhibit reliable cash flow and appreciation upside.
The analysis compares the gross rent multiplier (GRM) at purchase to the GRM at a future sale.
The hope is that the GRM today will align with the future. If the GRM at the sale exceeds the GRM at purchase, you are probably too aggressive with your annual appreciation assumption. You may want to scale it back until the GRMs are close.
I compare the Year 2 GRM to the Year 10 GRM in the example above. I use Year 2 as my base case because rents are severely under-rented. They will be stabilized in Year 2 once the inherited leases expire (remember, I phased in significant rental increases on the "Operating Summary" tab).
Year 10 GRM is less than Year 2, which means I am being conservative with my appreciation assumption (I am assuming the property sells for a lower GRM than I bought it for). It's so easy to ratchet up appreciation to make a deal pencil out. This analysis strives to check you and keep your upside within a reasonable threshold.
Cash Flow Summary
The last analysis piece of this worksheet is a simple cash flow summary.
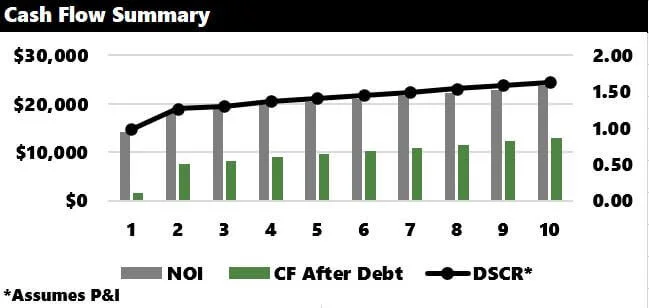
The bar chart will break down annual:
NOI
Cash Flow After Debt
Debt Service Coverage Ratio
This worksheet will provide a comprehensive summary of your potential investment. You can see all the significant facets of the deal in one central place that can be easily digested without flipping from tab to tab.
CAPEX Plan
This tab should be used lightly in a "Turnkey" investment strategy. This tab is far more potent if you are doing a significant rehab.

I am earmarking $2,000 for miscellaneous capital expenses that may arise upon taking over ownership. It's more of a safety buffer. The model assumes that any CAPEX spending on a turnkey analysis will be out of your pocket (not financed). If you were doing a rehab (as stipulated on the "Investment Summary" tab), the model would assume you finance the CAPEX budget.
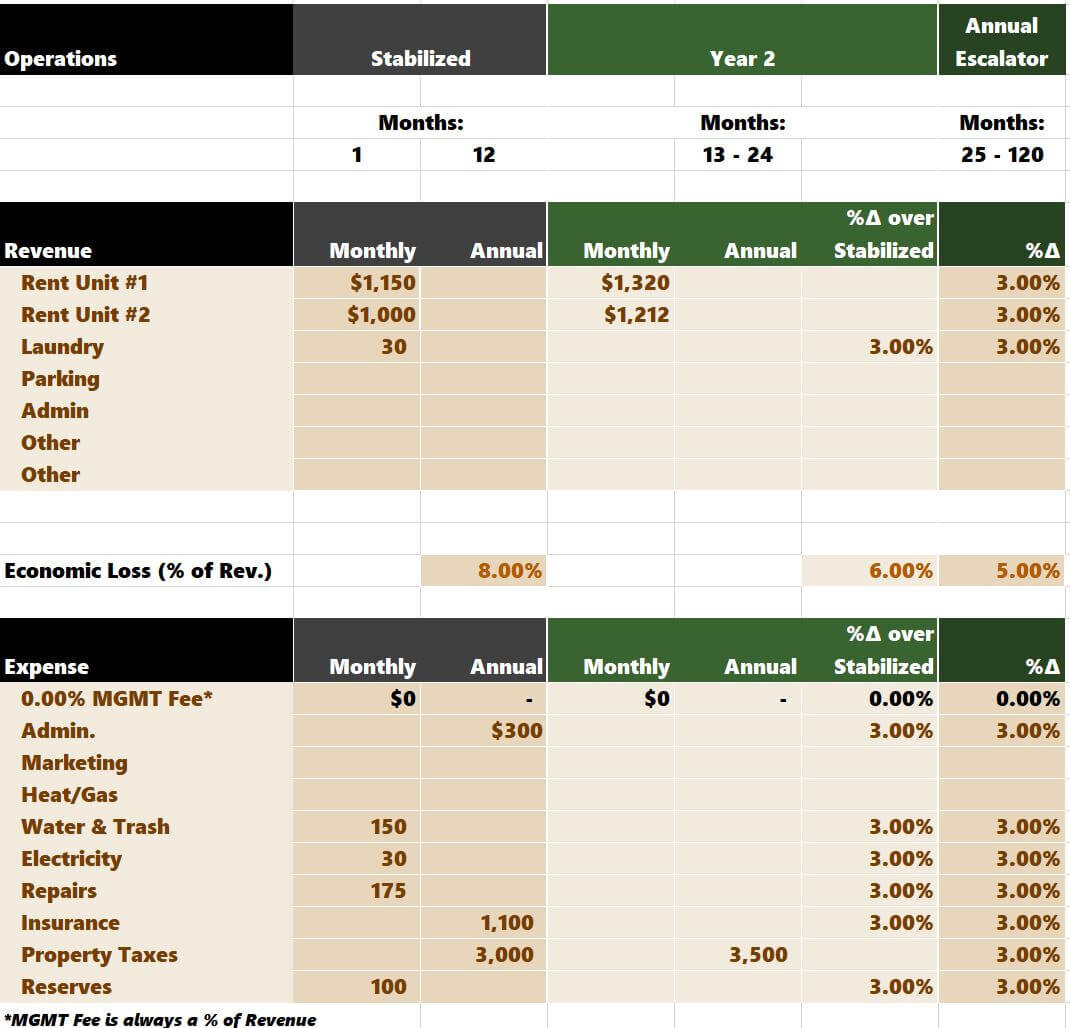
Operating Summary
This tab is where you enter your operating revenue and expense assumptions. You can make your assumptions on either a monthly or annual basis. Starting in Year 2, you can also forecast each line item as a percentage increase over Year 1.
Revenue
Here, you'd enter items like:
Rental Income
Quarter Laundry
Parking
Fees
Other Miscellaneous Income Opportunities
Economic Loss (Vacancy Rate, Rent Concessions, Missed Rent Payment)

Staggered Leases
If you are inheriting leases from the previous owner, there is a section where you can enter the details of the inherited leases and your future proforma expectations.

You can see in the example above that I am assuming that I inherit two leases. The leases are $1,000 and $900, with six and eight months remaining. After they expire, I will increase the monthly rent to $1,300 and $1,200. The following year, I will raise them by 3%. I would then take the "staggered" rent amounts in the dark tan column and paste them into the rental assumptions above. The leases are now "staggered" and are accurately depicted in the proforma.
This section is optional. You can also write what rents you want directly in the grid above.
Expenses
Like revenues, expenses can be made either on a monthly or annual basis. Most commonly, you'll need to make assumptions for:
Property Management
Administrative Costs
Marketing
Utilities
Maintenance Costs
Property Insurance
Property Taxes
Reserves
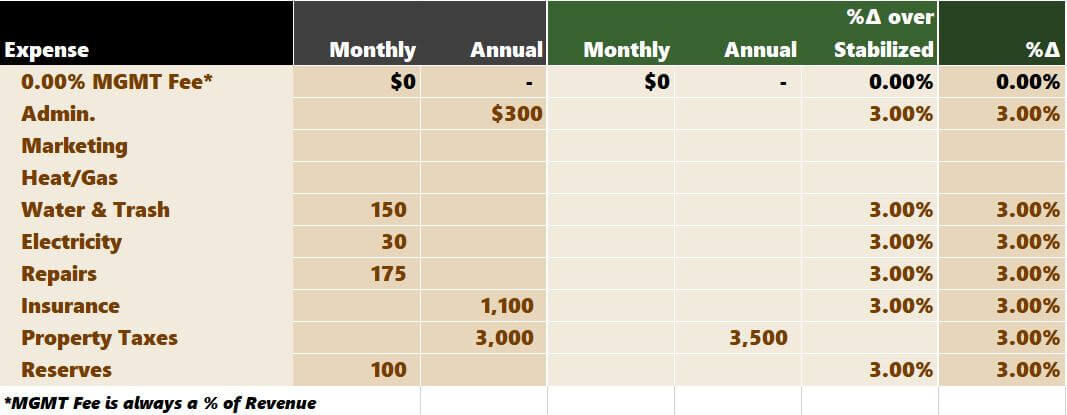
The property manager assumption is slightly different from the rest, as you must make this assumption as a percentage of total revenue. I wouldn't use a property management company, so I entered "0%".
It's important to note that for an income property to truly feel like passive income, you'd likely need to hire someone to take care of the day-to-day maintenance and leasing. Otherwise, be prepared to receive phone calls when something breaks, a tenant misbehaves, or a toilet is running.
In summary, my operating assumptions at a very high level:
Rents will increase considerably from their current levels.
Property taxes will increase substantially from the present amounts (from $3k to $3.5k).
All revenues and expenses will increase by 3% annually from Years 3-10.
Here is a summary of Year 1 Operations:
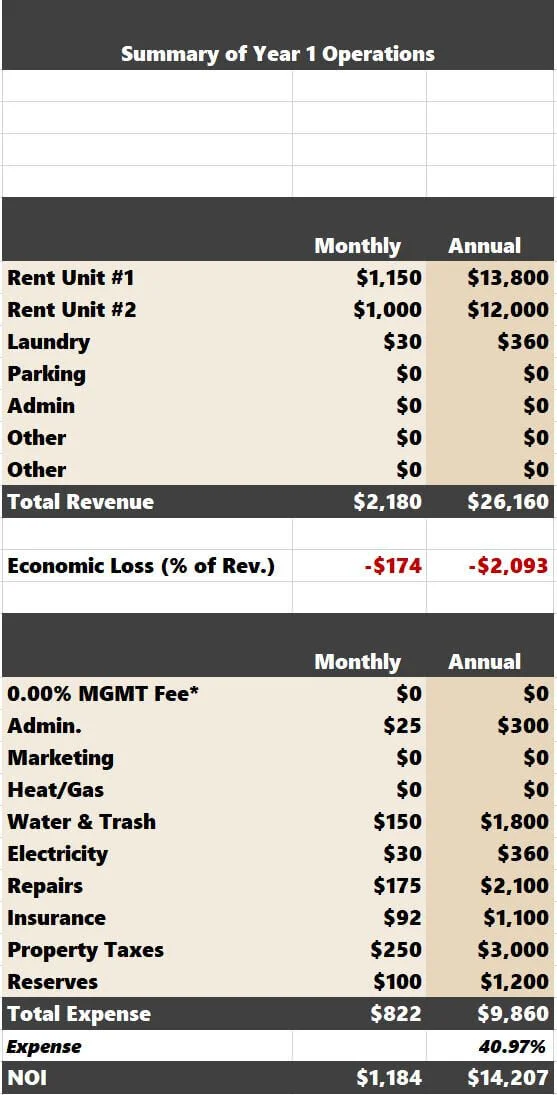
Finally, I can see the property NOI over a 10-year investment hold.
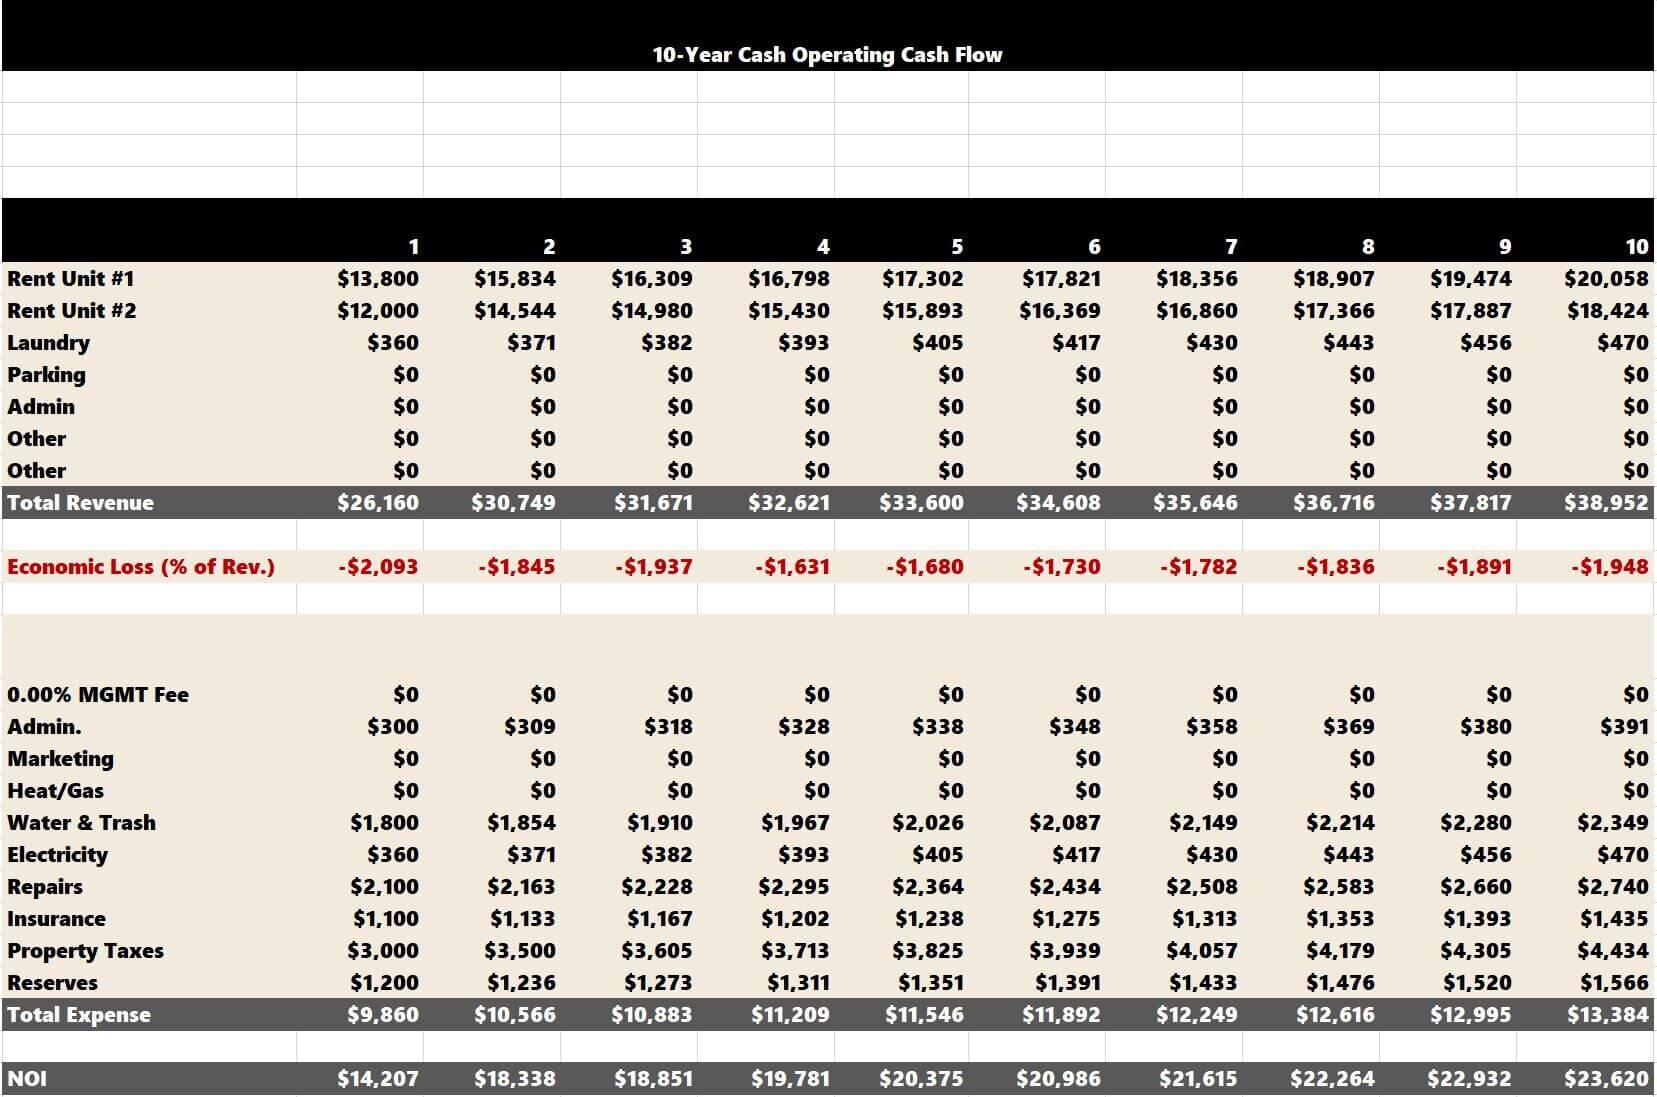
There will be a nice uptick in NOI once the rental increases are fully phased in.
Turnkey Summary
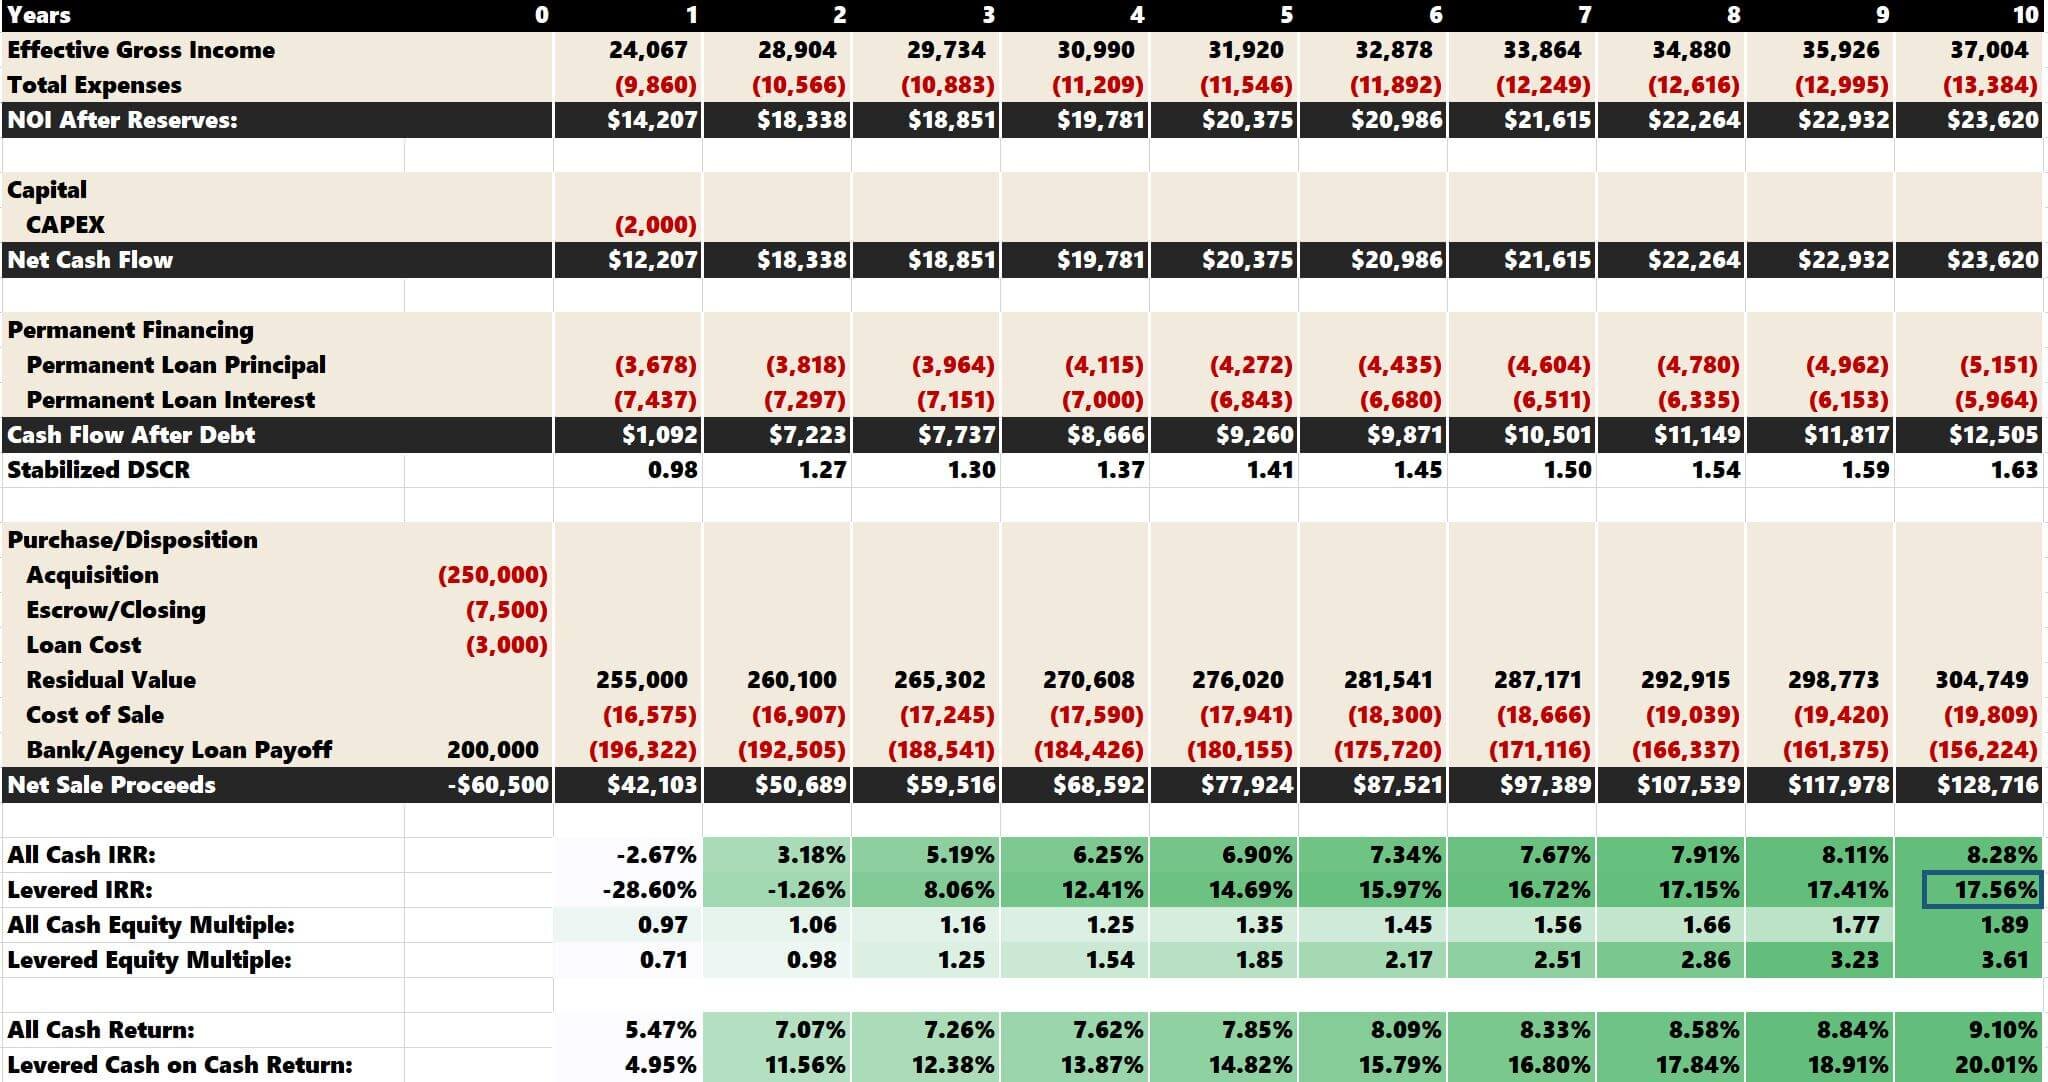
The "Turnkey Summary" tab stores all the return metrics. This tab will break down the following:
Cash Flow After Debt
The best part about this tab is that you can see how the return metrics will change over multiple holding periods. If you hold short-term for three years, the leveraged IRR of 8.06% is relatively pedestrian compared to a 10-year holding period that yields a 17.56% IRR.
I don’t include cap rates in the residential analysis. Cap rates require scale, and 1-4 units do not qualify. Quite frankly, I think cap rates can be a tricky metric, even on large multifamily properties.
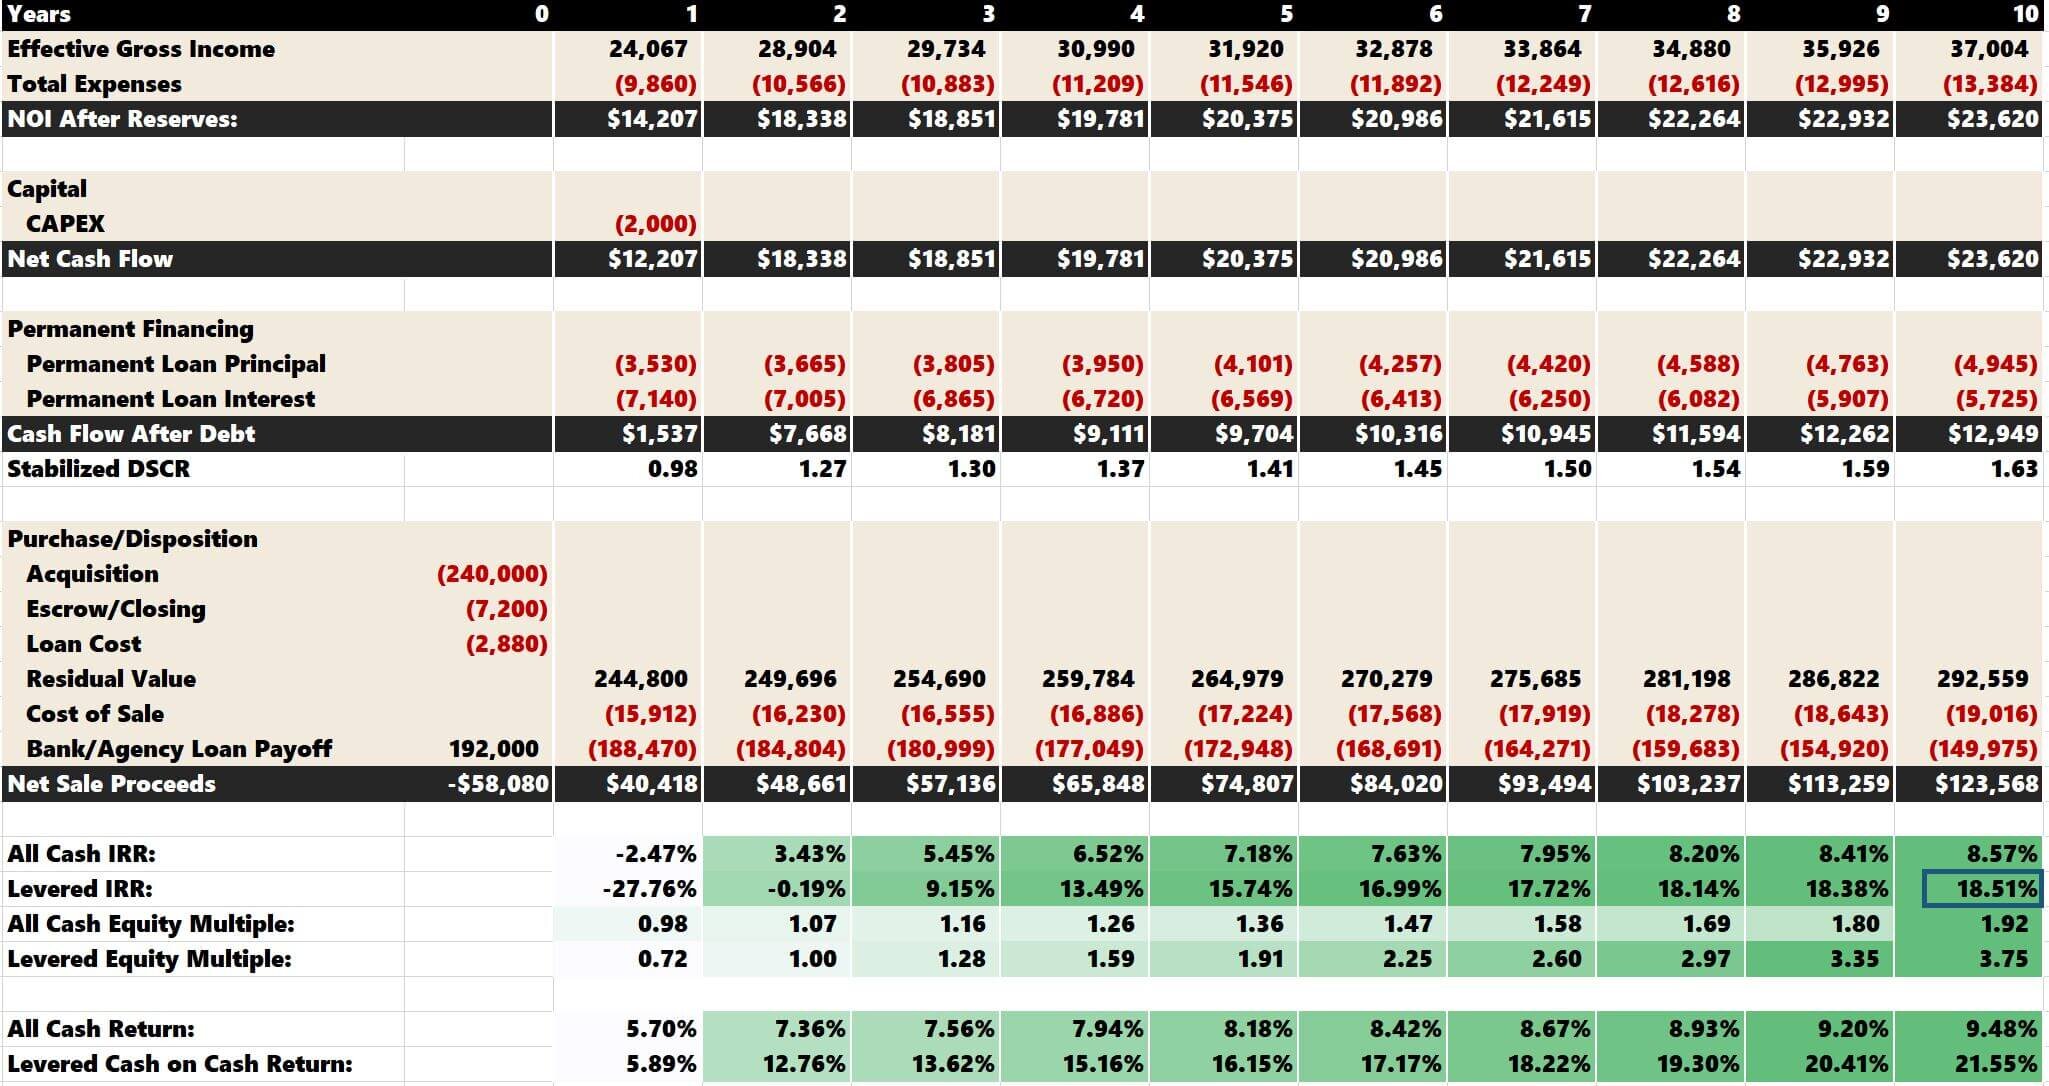
Suppose the returns show potential for a good investment. In that case, you can return to the "Investment Summary" tab, reduce the property value, and see how a lower purchase price could solidify an excellent investment opportunity.
When we lower the purchase price from $250,000 to $240,000, you will eke out an extra 1% annual IRR over a 10-year holding period.
The combination of cash flow, paying down debt service, and modest appreciation creates an adequate return the longer you're willing to hold. These wealth-building facets are why buying rental properties is such a popular real estate class for investors looking to grow their wealth.
Additional Application: Convert an underwriting template into a hybrid analysis that factors actual historical financial performance and updated future forecasts for optimal 'hold vs. sell' decision-making
Conventional Debt
The final tab of this analysis is just a storage space for the amortization table populated from the financing assumptions made on the "Investment Summary" tab. There aren't any assumptions to make.
Fix & Flip/Hold Rental Property Analysis
I dedicated an entire blog post to analyzing fix-and-flip opportunities. The blog post will discuss estimating the rehab budget, cash management, closing assumptions (purchase price and repaired value), and financing.
It will also walk you through determining whether flipping the property or holding it long-term is better. Having offers benefits from an income tax/after-tax returns perspective and can also be a more capital-efficient strategy over the long haul for property owners.
Summarizing Rental Property Investment Analysis
This blog post walked you through a real-life turnkey investment. The critical areas of focus were:
Acquisition Assumptions
Financing
Residual Assumptions
CAPEX (if any)
Annual Operations
Return Metrics
I used the Tactica Residential Analysis Model to analyze an investment opportunity properly. If you need a free residential analysis template, click the image below to download our free Excel analysis template. This is the first article in a two-part series. Part #2 covers using the Residential Analysis Model for fix/flip and flix/hold investment opportunities.


