Creating a 'Hold vs. Sell' Multifamily Analysis
A customer recently asked me if they could use a Tactica proforma to evaluate one of their properties. They purchased a real estate deal years ago, want to input their historical financials, and make future projections to determine what holding vs. selling the asset could potentially reap.
While all of the Tactica proformas serve to evaluate acquisition opportunities (or development), you can use them in more of a "hybrid" role (with some limitations).
We will use Tactica's Free Multifamily Template to show you how to analyze a project that is a mixture of actual financials and future projections.
Contents
Original Proforma Assumption Highlights
We're reevaluating a project we purchased two years ago. Some highlights from the initial underwriting include:
Purchased for a 5.11% cap rate (on actual T3/T12 Financials)
Locked in 10-year agency financing at 3.5% and 24 months of interest only (65% LTV)
Projected 5-Year IRR = 14.67%
Residual Cap Rate in Year 5 = 6.00%

Hold vs. Sell Proforma Alterations
Before commencing this step, "Save Workbook As." We will overwrite formulas and don't want these changes to impact the baseline multifamily proforma template.
The alterations will take place on three tabs:
Financials
Property Taxes
Valuation
Financials
The first step is entering the "actual" historical financials for the first two years of the investment.
I did that in the red cells. I also copied and pasted the original proforma estimates for revenue and expenses as values below the "total" row to compare how far off we were from the initial proforma projections.

Year 1
Proforma Year 1 Revenue: $1,019,987
Actual Year 1 Revenue: $982,684
Year 1 Delta Between Actual/Proforma: -3.66%
Year 2
Proforma Year 2 Revenue: $1,069,108
Actual Year 2 Revenue: $985,559
Year 2 Delta Between Actual/Proforma: -7.82%
The biggest issue thus far is that the actual revenue is falling increasingly behind the proforma. Expenses were also slightly more costly than initially projected.
Note: Since we overwrote the formulas in these columns, our assumptions in Years 1 and 2 serve no value.

However, for years 3-11, we can control the assumptions as before. A significant change in this version is backing off rent growth to 2% over the next couple of years due to record supply coming online.

Property Taxes
There's a lot at risk when forecasting future property taxes. When we underwrote this property in late 2021, we expected the property taxes to be reassessed at 100% of the purchase price in year three, which was a conservative estimate.

We received the county notice earlier this year that this did, in fact, happen. However, in the future, the assessment will likely fall.
Some distressed sales this year should impact our property assessment for 2024 (we’re estimating it falls to $7,000,000 from $7,800,000). Another change is that the applicable tax rate decreased from 2.09% to 1.84%, which is advantageous and requires an edit.

In summary, taxes will fall from $143,754 to $129,754 in Year 4 due to a softening property valuation and the applicable tax rate decreasing.

We project taxes will increase by 2% after that.
Valuation
There are two edits we need to make on this tab:
Historical Capex/Future CAPEX Projections
Residual Cap Rate Adjustments
CAPEX
We can enter the actual CAPEX spend for Years 1 and 2. We'll likely have a better feel for the property, and its future CAPEX needs coming down the pike. The historical CAPEX spend is entered in the blue columns, and future projections are $20,000 in Years 3 and 4.
Terminal Cap Rate
The market has shifted. We estimated this deal had a 5.50% cap when we purchased it two years ago and would increase by 0.10% annually and be 6.00% by Year 5.
Now, 6.25% is a more reasonable estimate for this asset class in this submarket. This change will impact sale proceeds and investment returns, especially if it continues to increase.
Note: The fact that this was initially underwritten at a 6.00% residual cap rate in Year 5 was very conservative and demonstrates why it’s beneficial to err on the side of caution.
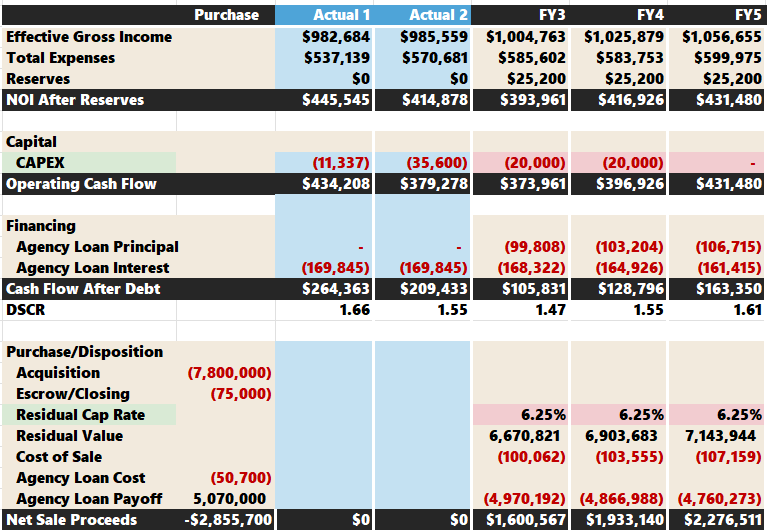
Hold vs. Sell Analysis

Initially, we projected that a sale in Year 5 would achieve a 14.67% IRR. Now, the leveraged IRR only hits 2.27% that year due to a variety of adverse factors:
Lower-than-expected revenue expectations
Revised (lower) future rent expectations
Cap Rate expansion due to rising rates
Selling today (in Year 3) would mean a loss. With our updated projections, the earliest we could achieve profitability would be in Year 5, but it would only mean slightly better a break-even proposition (1.10x equity multiple).
The cash-on-cash return will also drop significantly as the interest-only period runs out in Year 3 (outside of the frame of the above image).
Holding the asset longer is a viable pathway. It may be wise to keep the property for ten years and boost the leveraged IRR closer to 10% and the equity multiple greater than 2x. With some luck, rates and cap rates will compress in the next eight years, and returns could surprise on the upside.
Hold vs. Sell Limitiations
We only have a ten-year window to review the investment. If you purchased the property ten years ago, we couldn't do this analysis as we'd run out of space because all financial columns would be dedicated to the historical data. There’d be no runway for future estimations. It's most effective if you've owned the asset for a few years, with 2-4 years of historical information and 8-6 years of proforma projections.
Video: How t o Build a 'Sell vs. Refi' Analysis
Summarizing the Hold vs Sell Analysis
Creating a "Hold vs. Sell" real estate analysis in an existing proforma is possible and potentially enlightening. I showed you how to convert an underwriting template into a hybrid analysis that factors actual historical financial performance and updated future forecasts for optimal decision-making.
All Tactica templates limit the investment hold to 10 years. If you've held an investment for more than 7-8 years, this analysis may not be the most helpful as you'd only have a few years left to potential proforma outcomes.
The most beneficial scenario of this analysis is if you've held the asset for 2-3 years, have ample runway left in your investment hold, and can reevaluate current market trends and update future projections accordingly.
You can use this process on any paid proforma model. However, you'd need to be more thoughtful if using the Development Model or Redevelopment Model, as those tools include a refinance assumption.