Why Cap Rates in Multifamily Investing Are Misleading
Capitalization rates are usually the first metric discussed when looking for investment opportunities in commercial real estate. Ironically, I’ve learned over the years that cap rates are pointless when used to qualify multifamily properties. I won't speak for other commercial real estate investments, but cap rates don't mean much in multifamily analysis.
Cap Rate Contents
Cap Rate Nuance
If you are looking at an investment property with an NOI of $1,100,000 and the listing broker tells you that pricing guidance is a 5.50% cap rate, you should deduce that the seller desires approximately $20,000,000. I've consistently encountered that everybody involved in a real estate transaction will have a different perception of the actual NOI and how it should be evaluated. For example:
Is it tax-adjusted? Is significant real estate tax exposure factored in future years?
Is the 5.50% cap on trailing three revenue? Is it on the current rent roll annualized? Is it on the trailing twelve-month financials? Are CAPEX items included?
Will the property be managed similarly to the current owner?
Is there an abnormally high or low vacancy rate at this particular time? Is the cap rate accounting for a more “normalized” occupancy rate?
Questions like this make a cap rate ambiguous and difficult to conclude from. What further mucks the waters is that:
Sales Comp Data Is Biased
If you are counting on published cap rates from 3rd Party subscriptions, know that many of them will get their data from calling the transaction's seller, buyer, and broker. It’s commonplace for sellers to understate cap rates and buyers to overstate them. It's biased; the buyer wants to portray the cap rate better (higher cap rate = better deal), and the seller wants to show a more substantial sale (lower cap rate = better deal).
Brokers Finesse Cap Rates
When you are interested in offering a deal that has a low cap rate, a broker will typically say something like, "Yeah, well, it's not a 4.50% cap because there is a high vacancy due to some renovations taking place, poor property management, and obnoxiously high operating expenses. It's really like a 5.25% cap." The true cap rate is likely somewhere between the two.
Motivations
Some buyers are forced to pay a lot for a deal because they are incredibly motivated. The biggest motivation can be a 1031 exchange where a buyer has funds from a recent sale that they need to roll into a new investment to defer taxes. There are tight deadlines when utilizing a 1031 exchange, and it’s common for buyers to be more aggressive if they risk losing out on tax savings.
Another motivating factor is depreciation. Long-term owners often need to recycle capital into new deals to get another 27.5 years of depreciation (per IRS guidelines). Owners that buy and hold forever typically aren’t as sensitive about the purchase price and can be more aggressive.
Debt
Cap rates don't factor in leverage, and inexpensive debt has fueled aggressive pricing in many sub-markets nationwide. It's hard to compare cap rates apples-to-apples when you don't know what debt instruments specific buyers can access. Lower interest rates and interest-only (IO) have allowed real estate investors to juice their cash flows considerably.
It will be interesting to see if cap rates continue to compress in 2022 when interest rates and debt spreads have increased materially coupled with a hawkish federal reserve tone.
CAPEX
Deferred CAPEX is ignored in cap rate calculations. This isn’t optimal for projects needing a total repositioning effort with a multi-million dollar capital budget. The purchase price isn’t a great barometer to divide the NOI by.
Tactica's Cap Rate Definition
A cap rate is just a benchmark. It's a way to classify and peg a deal in the marketplace.
For me, a “perceived” good cap rate alone will have zero impact on whether or not a deal is intriguing. There are too many unknowns at the surface level. It isn't a metric I care about when analyzing the quality of a potential deal. I check a box to ensure the deal is reasonably priced. Before paying attention to the cap rate, I am focused on the Internal Rate of Return (IRR), the price per unit, the price per SF, and the cash-on-cash returns.
Cap Rate Trends
I think cap rate trends are valuable in bulk when analyzed over a specified time series in a particular geography. While a “quoted” cap rate on one sale may be ambiguous, hundreds of cap rate data points are much more valuable.
The major brokerage shops compile cap rate intel from all sales under their purview. CBRE’s Q4 National Multifamily Cap Rate Report paints a remarkable picture of how the multifamily investment class has unfolded over the last decade.
Cap rate compression has been steady since 2015 but has accelerated in 2021.
Cap rate compression in the Southeast and South Central has far outpaced the Northeast and Pacific West.
The multifamily investment class is more valuable today than seven years ago (by about 16% on average).
Qualitative Cap Rates
It's also a way to tell a broker what properties interest you. If you call a Minneapolis broker and tell them, "I am looking for a 3.75% cap deal." They would know that you want new construction in a Class A location.
If you told them you want a 4.50% - 4.75% cap, they would know you are interested in a property with a value-add upside.
For me, cap rates have been a quantitative way to explain something qualitative (aka the property type and asset class). These cap rate thresholds will vary by the real estate market. New York City will have very different cap rate thresholds than Williston, North Dakota.
Three Cap Rate Analysis Tips
While taking a cap rate at face value is not beneficial, there are some exercises where you can use them to bolster an analysis. I use three different cap rate analyses regularly.
Understanding The Cap Rate Spread
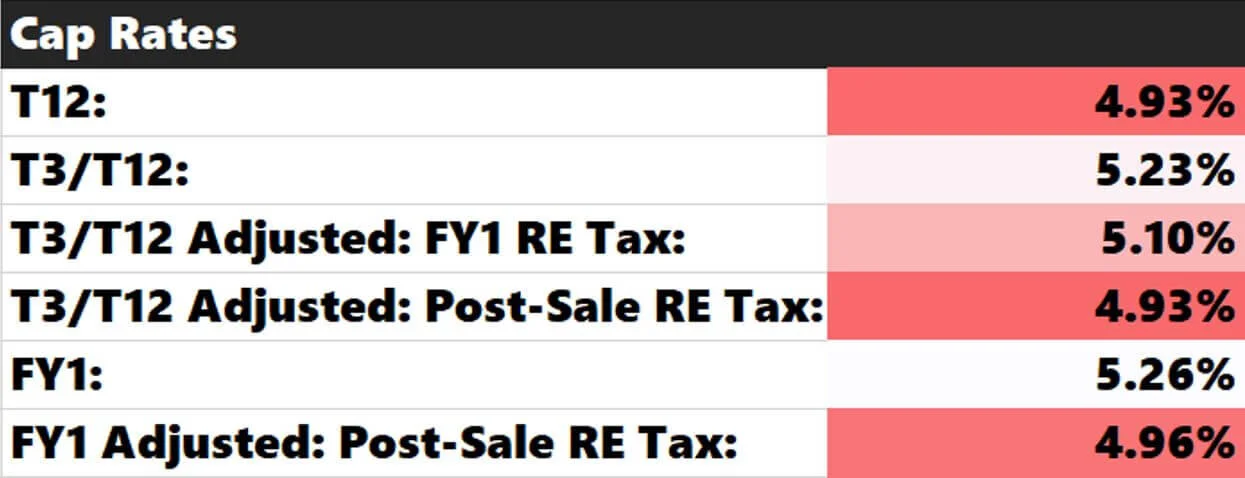
I don’t look at just one cap rate. I get as much information as possible by looking at as many cap rates as possible for historical periods and what I am projecting for future periods. Here’s an example of a deal I was recently analyzing. Pricing guidance was $19,000,000. The cap rate spread was the following:
Conditional formatting will shade the lower cap rates red. Below is a description of what each cap rate is representing:
T12: The historical trailing-twelve-month NOI and dividing by $19,000,000
T3/T12: The trailing three-month revenue annualized minus the T12 expenses and divided by $19,000,000
T3/T12 Adjusted: FY1 RE Tax: The same as T3/T12 but substitutes the T12 real estate tax expense with the Forecasted Year 1 (FY1) real estate tax expense. There are many instances where FY1 real estate tax expense will already be proposed ahead of time, so factoring it in is helpful.
T3/T12 Adjusted: Post-Sale RE Tax: Same as above, but now real estate tax expense is calculated as the complete reassessment amount post-sale. For this deal, the property is only assessed at $16,750,000. If the property sells for $19,000,000, this will create a lot of future tax exposure for the buyer. This exposure will hit the proforma in Year 2. The FY2 real estate tax expense is being used as the adjustment.
FY1: This is the FY1 proforma NOI divided by $19,000,000
FY1 Adjusted: Post-Sale RE Tax: Same as FY1, but the real estate tax in FY2 is being used as the adjustment.
Looking at the above grid, these are the conclusions I am coming to.
The property’s operations have been improving, as seen by the jump in cap rate from T12 to T3/T12.
There is a small amount of real estate tax exposure in Year 1 of the proforma, as the T3/T12 cap rate of 5.23% falls to 5.10% once factoring in the FY1 real estate tax expense.
There is significant tax exposure post-sale because the FY1 cap rate of 5.26% falls to 4.96% when adjusting for the FY2 real estate tax amount.
This deal would likely be marketed as a 5.25% cap. Once somebody buys the property at the pricing guidance of $19,000,000, it is genuinely a 4.96% cap deal once factoring in the future real estate tax exposure.
Stressing the Residual Cap Rate
If you analyze assets using a discounted cash flow (DCF) model, your investment decision will likely hinge on the residual cap rate. Minor adjustments can swing the asset value by millions of dollars and make a bad deal look superb.
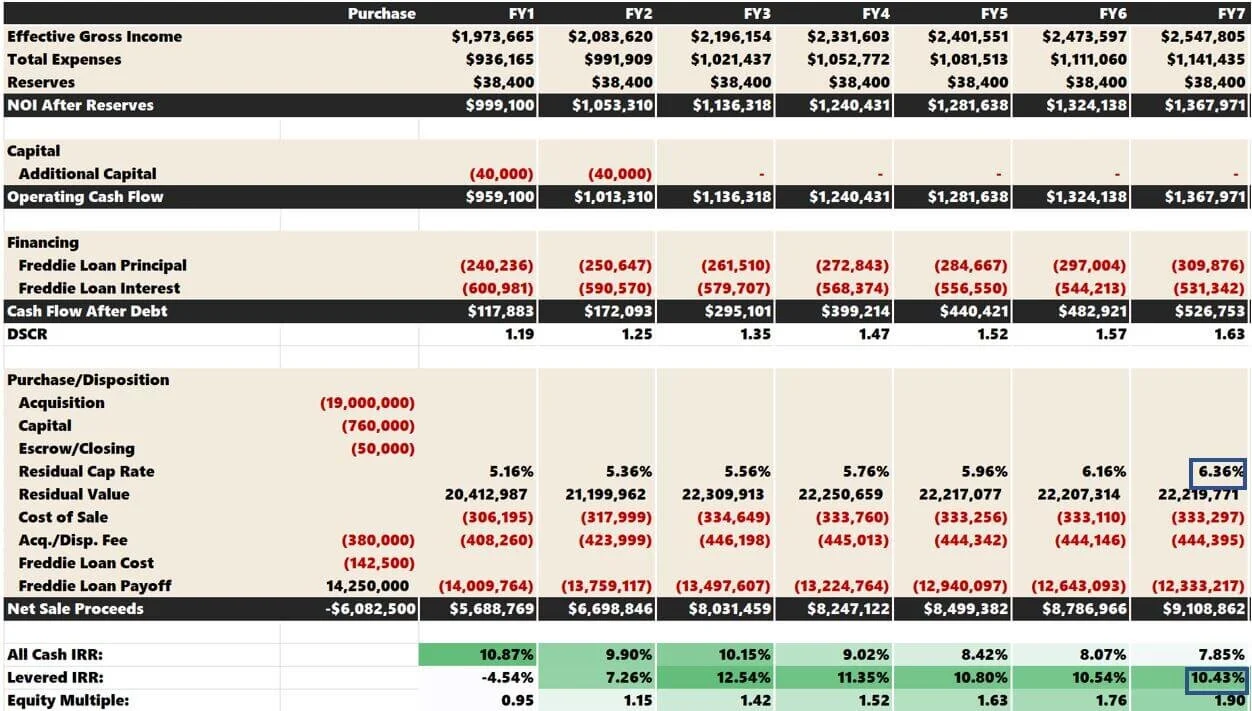
Let's take a deeper look at our sample from above. Let’s review how this deal would look if the plan were to sell in Year 7 at a 5.66% cap.
The levered IRR is 13.85%
It’s a solid IRR in the current investment environment. It’s worth talking more about this 5.66%. Where is it coming from, and why is it subjectively used as the residual cap rate?
The financial model is set up to increase the going-in cap rate by 10 basis points (bp) per year. The going-in cap rate is 4.96%, the Year 1 tax-adjusted cap rate from above. The residual cap rate is a 10 bps increase yearly for seven years (70 bps).
It is my opinion that while this assumption is reasonable, the deal needs to be stressed further. What if the residual cap rate was 140 bps more in seven years from now (double)?
This would result in a 6.36% residual cape rate, and the levered IRR would drop to 10.43%.
The Dilemma
When underwriting an acquisition opportunity, you are at the mercy of what the market thinks the residual cap rate is. If you are trying to buy a deal and using a 100-bp spread from your going-in cap rate to your residual cap rate, but the market uses 50-bps, you will never win a bid. My advice is the following:
Underwrite your residual cap rate within reason of the market consensus. If you get a solid levered IRR when doing so, stress it further. In the example above, I doubled it. The IRR fell significantly to 10.43%. Would this still work for you? For your investors? If not, I would pass on the deal.
Recently, I’ve been working on multiple deals I last underwrote two to three years ago. Pricing exceeds thresholds from 2018 to 2019 solely because of cap rate compression. There were numerous instances where operations are worse today (higher vacancy and lower overall NOI). Still, pricing is higher because of a 50 bps decrease in “going-in” and “residual” cap rates.
Loan Constant Comparison
Comparing the cap rate to the loan constant is simple yet powerful. First, I’ll define the loan constant.
Loan Constant = Annual Debt Service Payment / Loan Amount
In this particular deal, I am assuming the following terms for financing:
The annual debt service (principal and interest) would be $841,217
Loan Constant = $841,217 / $14,250,000 = 5.90%
The true cap rate = 4.96%
Loan Constant > Cap Rate
When the loan constant exceeds the cap rate, debt isn’t accretive to returns; it hurts them. We can see this when we compare the cash-on-cash returns to the theoretical all-cash returns.
Notice that the cash-on-cash returns are lower than the all-cash returns in years 1-3. Stated differently, leverage hurts the annual yields compared to purchasing the deal in cash. It wasn’t until FY4 that there was enough revenue growth to make the debt accretive, which, in turn, gave the annual yields a boost.
The Band-Aid
What you see in the image above is expected in the current market. Buyers are leveraging as much as possible and banking on revenue increases to improve future yields. Many buyers will initially get interest-only (IO) (typically in years 1-2), which helps bridge this gap between strained cash flow and a stabilized proforma. If we plug in 24 months of IO, look at what happens to the cash-on-cash returns.
Now, the debt is truly accretive every year except Year 3. This is risky, though, because ownership could be very cash flow-constrained if the business plan isn’t effective when the IO term ends.
If you can find a deal where the true Cap Rate > Loan Constant starting in Year 1, you have found yourself a home run. This is incredibly rare. The fact that over-levering a deal on the front end has become the norm makes me nervous for 2-3 years in the future when IO terms start running out on the investors that are aggressively buying deals today.
Summarizing Cap Rates
Cap rates on their own are pretty much useless. You should think of them as a qualitative metric vs. an analytical one. If you are realistic with the true cap rate going into the deal (factoring in all adjustments), you can use them for a more robust analysis, as I described in the paragraphs above.


