Multifamily Real Estate Market Research Template
I’ve published multiple articles on how an investor should assess the high-level market fundamentals when investing in commercial real estate. I’ve implored investors to step back and focus on multifamily market research before diving into the property business plan.
Tactica’s free multifamily market analysis allows investors to compare multiple real estate markets (up to six). You can input data for any city you’re familiar with (usually your local market) and then investigate other cities, counties, or MSAs for a robust comparison of significant labor and rental statistics. I suggest you download the template now so you can read the rest of the blog post with it open.
Note: I have since created a market research dashboard that tracks nearly all of this data in ONE PLACE. Click the link, click your city on the map, and start combing through the data.

Download our Free Tactica RES™ Multifamily Market Research Analysis Template
The multifamily market research template allows you to compare and analyze labor statistics and rental fundamentals of various cities and metropolitan statistical areas.
Real Estate Market Analysis Template
Market Analysis Research Overview
The market research template tracks 44 different metrics that I feel are important to investors researching a city. These metrics are broken into two major categories with multiple sub-categories. The boilerplate real estate market analysis that you download is unlocked. You can add rows with new metrics or data points necessary to you and your investment outlook.
Multifamily Market Research Resources
I use free resources for every data point I track in the market research template.
The Bureau of Labor Statistics gathers unemployment, labor force, and employment data. If you downloaded the research spreadsheet, all the resources I use to collect market research are included to the right of the input grid. I’ll also include links to other tutorials in this blog post to help you seamlessly download and decipher data from various sources.
Real Estate Market Analysis Example
A multifamily market research analysis is far more powerful when you look at multiple cities (or counties). It could be cities in the same state or scattered across the country. I recommend comparing no less than three cities.
As an example, I found labor and rental stats for three Texas Markets:
Austin, TX
Dallas, TX
Houston, TX
Labor Statistics
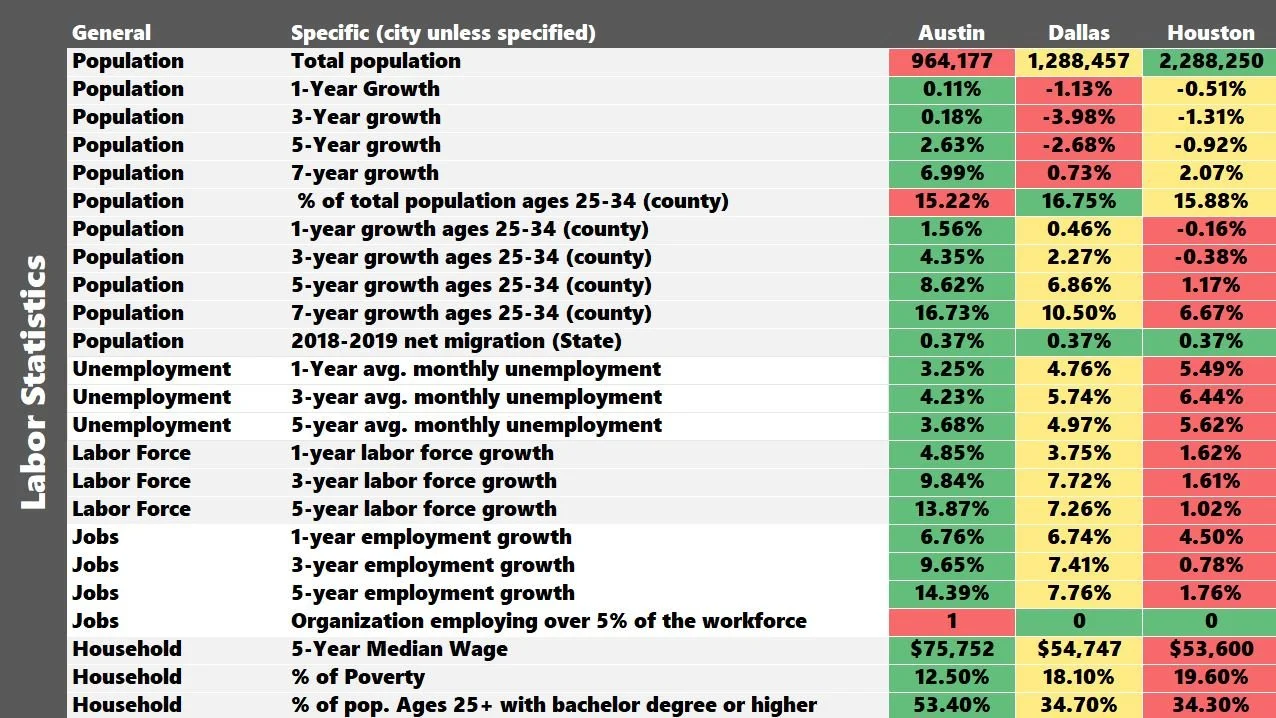
Population
Population growth is the lifeline for property investors from all walks of life. Population growth is paramount to a healthy rental market. You can search your city of interest directly on the census website for high-level population intel.
There is other helpful demographic data on this page with information about the housing market, healthcare, and education.
Population Growth
You’d hopefully see a growing percentage of residents moving into the city
To find this data, the Census organizes population data by decades. There are two pages we need to review:
I also like to look at population growth for one year, three, five, and seven years. You can use the most recent population estimate as the base year and compare the above reports to past years.
Millennial Population Growth
I like to look at the age cohort of the population. Ideally, you’d see a large cohort of the population aged 25 - 34 (Millennials) and robust growth coming from these folks.
This “Young Adult” or “YA” age group has arguably the most potential in the workforce and is entering its prime. More young, professionally aged workers entering the county are bullish for future employment fundamentals. The hope is that these people “set their roots” in your city, start families, and become “stickier” long-term residents.
Uncovering the population trend for different age groups requires a bit of elbow grease. I created a tutorial on where to find this data and break out age-related population trends.
State-to-State Population Migration
The states you choose to invest in are affected by population changes. If you think about it, it’s a giant competition between states regarding attracting residents, business, and investment.
I explain this metric and rank the states from best to worst in “net migration.”
Enticing new residents from other states can be a massive boon for the local economy and make the investment outlook much brighter than a state losing people annually.
Employment Statistics
The following section focuses on employment:
Unemployment
Labor Force
Jobs
Major Employers
Unemployment/Labor Force/Jobs
The hope is to see strong growth in the labor force and jobs and low unemployment compared to the national average. It would be best to verify that residents make good, livable wages and that diverse industries and robust employment opportunities exist.
I lean on the Bureau of Labor Statistics data for unemployment, labor force, and job information.
Major Employer(s)
I get nervous when I see one employer supporting most of the employment market. If they ever leave, go bankrupt, or cut jobs, the impacts on the submarket would be catastrophic. Usually, a Google search of “major employers” or “top employer” will let you know if any company is responsible for a disproportionate percentage of the local employment.
Household Wages
The final piece of the labor statistics relates to households, specifically median household wages, poverty rate, and education achievements. Higher education levels correlate with higher salaries and a healthier rental market. The last three labor statistics we look at come from census.gov quick facts and involve median income, poverty, and education.
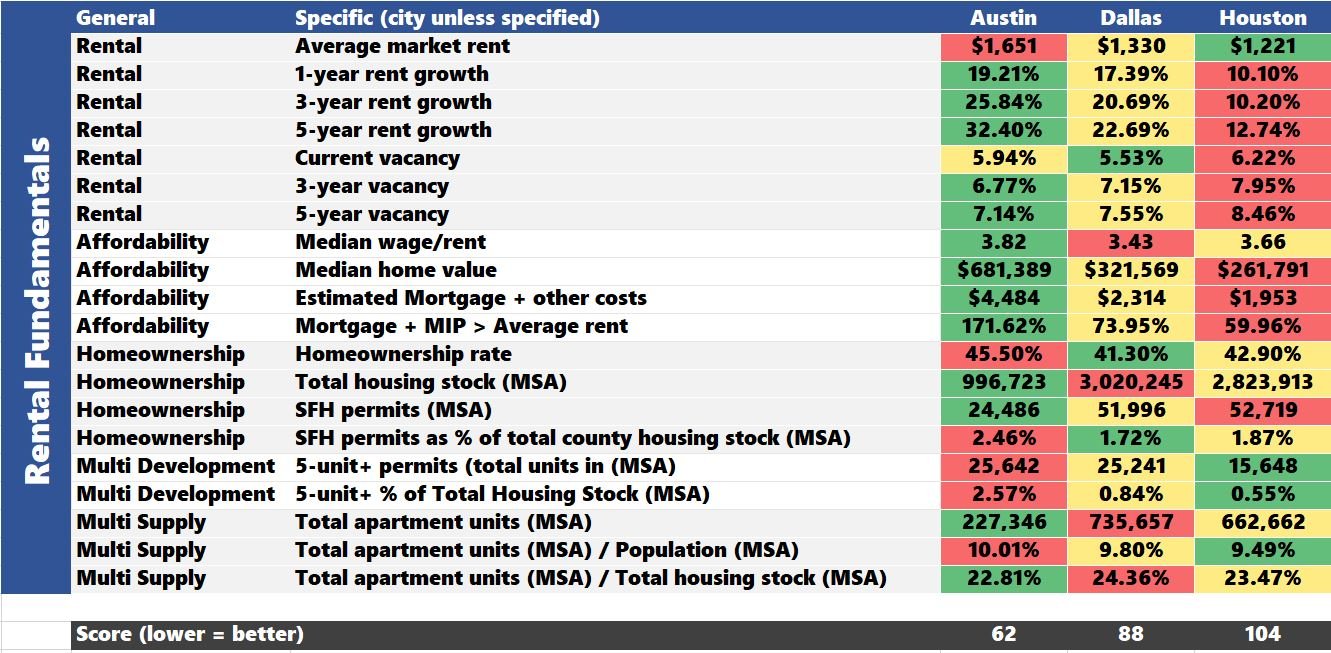
Rental Fundamentals
The next part of the research template is devoted to multifamily rental fundamentals.
First, I want to point out that I consider the following bullets part of the property-specific analysis.
Sales Price Comps
I’ll assess these bullets in my property underwriting workbook. We are now discussing multifamily fundamental market trends (much higher level).
Rental Trends
The current average rent and rental growth trends are crucial to understanding. Increasing rents in a submarket make development projects more enticing and value-add more lucrative. Looking at the current rents of a submarket and how they’ve trended over the years is an essential step. Preferably, historical rental data shows good growth over the past 3-5 years and overall rent levels that are still affordable for a large pool of residents.
I use Apartment List for rental data as they publish monthly reports on rental and vacancy trends.
You can also read about Apartment List’s calculation methodology here. A local “boots on the ground” commercial real estate brokerage team, realtor, or other real estate service providers may also help you with rental statistics in a city or neighborhood.
Affordability
I like to look at local incomes and compare them to the average submarket rents. Ideally, incomes will be much higher than rent levels, and renters can comfortably afford their monthly rental obligation. It’s shocking how much cities can differ when comparing their local income-to-rent ratio:
Income-to-Rent = Annual Median Income / (Average Monthly Rent x 12)
In Minneapolis, this ratio is nearly 5x; in Miami, it is not even 2x.
Another factor is home prices. Home prices in the area will play a big part in what you can charge residents for rent. A cheaper for-sale home supply will make it harder to justify rental increases. Why would a renter continue to pay annual rent increases when they can live in a home that is much cheaper?
I've studied markets where homeownership can be nearly 50% cheaper than renting a Class A apartment building! That's a problem for apartment owners/developers.
I use Zillow to keep up with single-family home market values. Valuations in most markets around the country have accelerated since 2020, which bodes well for apartment owners. Many “would-be” first-time homebuyers are priced out of purchasing a home, and renting is the more sensible option.
Higher median home prices create a higher barrier to entry to homeownership, especially for first-time homebuyers. I estimate the monthly mortgage obligation as follows:
Principal
Interest
Insurance
Property taxes
Using the Zillow estimate above, I assume a 5% down payment for principal interest, the current market interest rates on debt, and a 30-year amortization.
For the “other costs” like insurance and property taxes, I lean on the Census.gov quick facts for “housing costs without a mortgage” and tack them onto the principal and interest payment.
Note: It may also be wise to account for a mortgage insurance premium (MIP) on top of insurance and property taxes.
I then like to compare:
Theoretical Mortgage Payment vs. Local Market Rent
The greater the cost of homeownership, the more sensible renting is.
Homeownership
It’s essential to dig deeper and understand the local housing landscape.
You can get the homeownership rate from the Census.gov quick facts.
The higher the homeownership rate, the more likely you’ll lose apartment residents who convert to homeowners.
I also like to know the total housing stock (rental, SFH, condos, etc.). The Census website provides housing stock data broken down by county.
Finally, I want to know how many single-family homes are planned. Too much new housing supply could be troubling for apartment rentals. The Census provided MSA-specific permit information on single-family home permits (updated each May for the last year).
Multifamily Development
If you’re a developer, you’d be wise to run the same calculation as we did for SFHs but for apartment units (or the number of permits for structures with 5+ units). The lower, the better if you are a multifamily developer. The higher this ratio, the more competition you’ll be against when leasing the units.
Multifamily Supply
Supply metrics are essential if you’re looking to enter a new market. Oversupply of apartments can lead to high vacancy and dismal rental trends, thus making it hard to maximize cash flow. I like to look at the total rental units in the MSA.
That number alone doesn’t tell us much. Divining it by the population and total housing stock gives you valuable insight into the population compared to other markets around the country. High ratios don’t bode well for investors entering or actively participating in the market with large investment portfolios.
Multifamily Market Analysis Ranking
I included a very rudimentary ranking system. For all 44 statistics, each city is ranked 1-3 (one is the best, three is the worst). The lowest score is the “best” market, as that city ranked #1 in most categories.
#1 Austin Ranking: 62
#2 Dallas Ranking: 88
#3 Houston Ranking: 104
It’s important to note that specific metrics are likely more crucial than others and could be weighted differently. All metrics are scored equally in the free download.
Summarizing Multifamily Market Research Template
If you’re interested in a real estate market research template, this free market research template should be a great tool to get started. The research spreadsheet tracks 44 metrics related to:
Population, Growth, and Trends
Unemployment Rate
Labor Force Growth
Employment Growth
Household Wages, Poverty, and Education
Market Rent, Rental Growth, and Vacancy
Affordability
Homeownership, Housing Stock, and Permitting
Multifamily Development Permitting
Multifamily Supply
Understanding the economic fundamentals of a given submarket is one of the most critical yet dismissed exercises in investment analysis. I hope this article gives you some ideas on vetting cities when looking for your real estate investment properties.