Optimizing Multifamily Operating Expense Underwriting
When I first began learning about the multifamily investment business, I was always intimidated by operating expense underwriting. The superiors working with me would suggest things like:
Underwriting marketing expenses at $200 per unit
Setting property taxes at $4,000 per unit
Charging a property management fee of 5% of effective gross income (EGI)
As a fledgling analyst juggling multiple properties simultaneously, I needed to understand how operating expenses should pencil out. I created a robust system and intend to teach you it today.
Contents
Apartment Operating Expenses Primer
Operating expenses are the recurring costs incurred from “normal” business operations. Capital expenditures (CAPEX) or other non-recurring or “non-ordinary” expenses do not qualify as multifamily operating expenses and should be classified differently. Traditionally, operating expenses are:
Administrative
Property Management
Payroll
R&M
Repairs/Maintenance
Turnover
Contract Services
Utilities
Insurance
All expense items listed above are generally recurring and are necessary to keep the property functioning, well-occupied, and in good physical condition.
Multifamily Expense Ratio
The most commonly used operating expense analysis is the apartment operating expense ratio. The formula is simple:
Operating Expenses / Total Revenue
If total apartment revenue were $430,000 and total operating expenses were $250,000, the expense ratio would be:
$250,000 / $430,000 = 58%
Experienced apartment operators know what this ratio should be within reason. For example, a broker markets an apartment complex with a 58% expense ratio. A professional investor knows she can operate this property at a 45% ratio. She could see an immediate investment upside if she purchased the building (as she’d cut expenses significantly and see a higher NOI).
The multifamily expense ratio is helpful and great for benchmarking properties of similar vintage and unit count. However, it does lack transparency, and I think there are more thorough ways to investigate a property’s operations.
Multifamily Operating Expense Comp Database
Years ago, I had compiled an Excel spreadsheet with hundreds of property comps and their respective revenue and expenses on a per-unit basis. I even recorded the net operating income (NOI) per unit for each property, along with the multifamily expense ratio, values of each property, and cap rates.
I added all revenue and expense data for every property I analyzed for over five years. It was my Friday routine to go through all the deals I modeled during the week and break down every revenue and expense line item on a per-unit basis.
I didn’t pay much attention to the revenue line items. I had other ways to analyze rental income, vacancy rate, and rental concessions. However, tracking ancillary income items such as parking, storage, pet rent, and fees/damages was helpful as these items tended to vary greatly depending on the property manager.
Because I initially constructed this workbook for learning purposes, I never structured the data in a way I could easily manipulate for further analysis. For example, the kind of questions I desired to answer with the information I had compiled were along the lines of:
"How much has property insurance expense per unit increased since 2014 on Class C apartment buildings under 100 units?"
"What is the difference between Management Fees for a property with 50 units vs. one with 250 units?”
"What is the difference in utility expenses between Class A, B, and C buildings with more than 150 units?"
"How do real estate taxes vary in the different submarkets around the Twin Cities?"
It would take me an hour to get my historical data into a format that could begin to answer and interpret the above questions. I will save you time by teaching you how to properly organize the expense data on the front end to provide immediate insights.
Open up a fresh Excel workbook, and let’s begin.
Apartment Building General Info
Before getting into the expenses, for each property, you will need to record:
Name (or address)
Property Type (garden-style apartment, highrise, midrise, townhome, etc.)
Construction Year
Number of Units
Date of Analysis
City
State (If analyzing multifamily properties in multiple states)
The categories above are flexible and can be altered to fit your preferences. You may want to include other information, such as whether the property has seen a significant value-added strategy, a ground-level commercial real estate component, or if the property is at the market rate/affordable.
Make sure you ponder these headers thoroughly on the front end because once you enter expenses for many apartment complexes, it will be time-consuming to go back and add more information and update past entries. Below is how a sample property would be recorded:

Apartment Building Expense Categories
Every property you analyze is an opportunity to build up an operating costs database. I recommend categorizing expenses more generally. For example, repair and maintenance (R&M) could include maintenance costs, turnover, and contract services. Many management companies don’t break out R&M into subcategories, while other ownership groups may. You are striving to get more of a general sense of total operating expense instead of pinpoint accuracy. Making this Excel spreadsheet overly complicated is not necessary. Keep it simple with fewer multifamily operating expense categories if you can.
Note: Always subtract capital expenditures (CAPEX) or any other significant capital improvements included in the historical financials. Many owners (especially smaller private owners) will throw CAPEX into the R&M line item. When underwriting the acquisition opportunity, you should vet how much CAPEX is included in the historicals and exclude it from the operating expense.
Multifamily Operating Expenses Per Unit
I implore you to consider apartment operating expenses on a “per unit basis.” There is no better way to instill a firm grasp on expense underwriting and understanding what is reasonable vs. unreasonable. All Tactica multifamily acquisition models calculate the “per/unit” for you and can be easily added to the operating expense database.
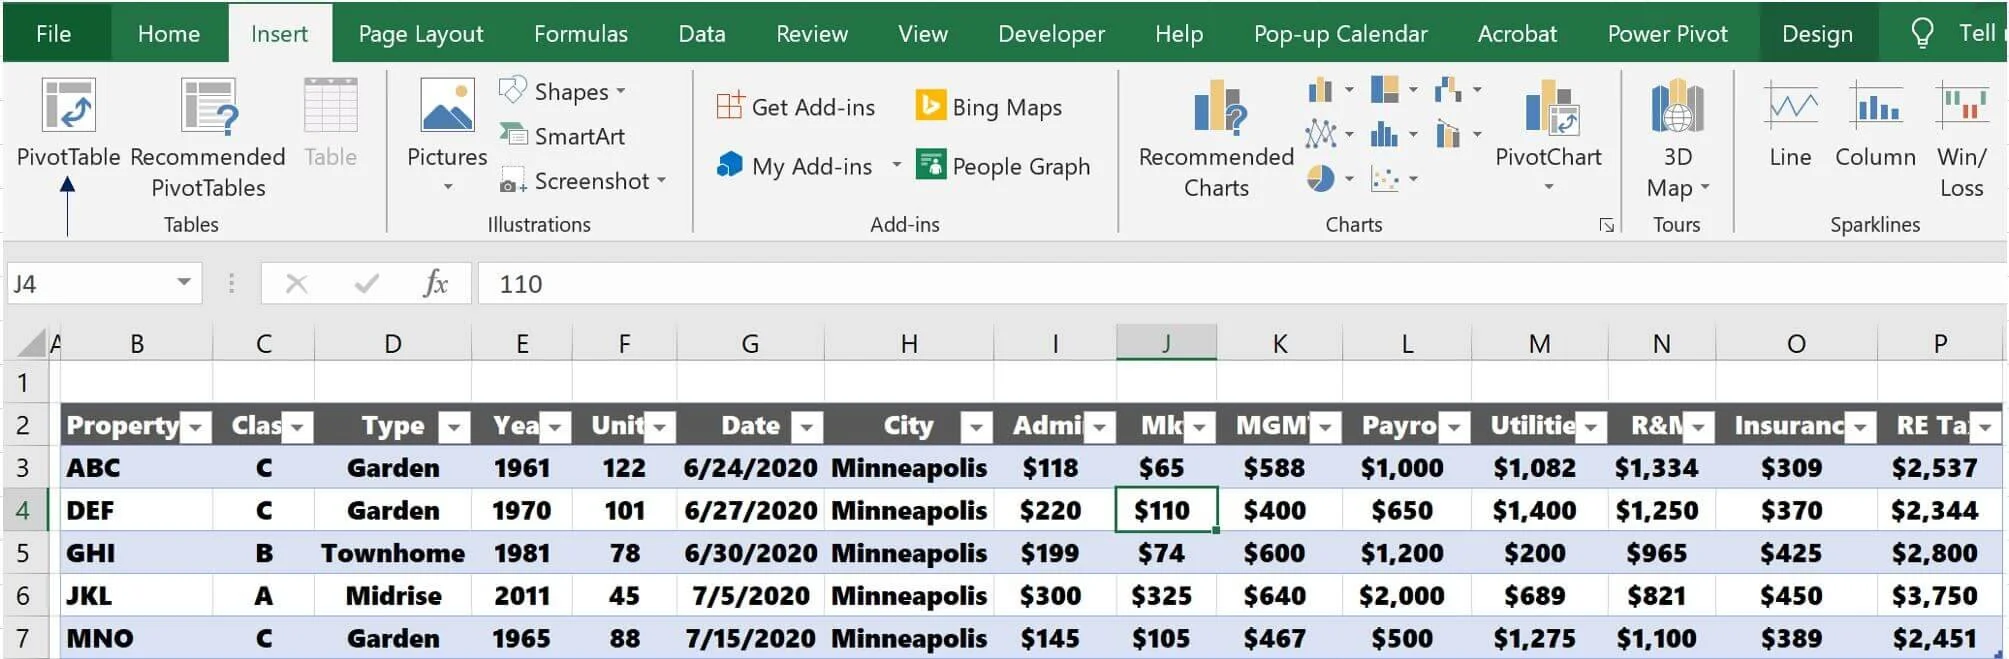
I will take the expenses per unit directly from the Tactica Value-Add Model:
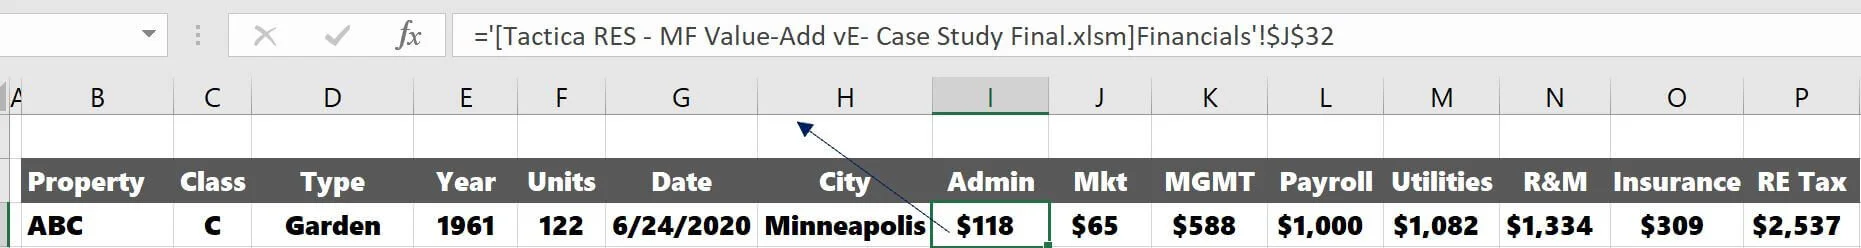
It takes less than one minute to grab this data! After I have captured all the expenses per unit, I will copy and paste them as values over the formulas (columns “I” - “P” in the image above) so the data is not continually refreshed every time I open up the workbook.
Highlight cells “I” - “P” and enter Ctrl + C followed by Ctrl + Alt + V.
Now select paste as “Values” and click “OK.”
The values are no longer linked to the source underwriting workbook but are independent hard-coded values.
Multifamily Operating Expense Analysis
The final part of the blog post is dedicated to explaining how to set up this workbook to be dynamic. The idea is that you will continually incorporate more expense comps into this workbook. Whether you have five properties or 500, the data must be easy to manipulate and dissect.
Step 1: Creating a Table
The first step is converting the expense data to an Excel table. Click on any cell within the data set, click "Insert" in the main navigation, and select "Table."

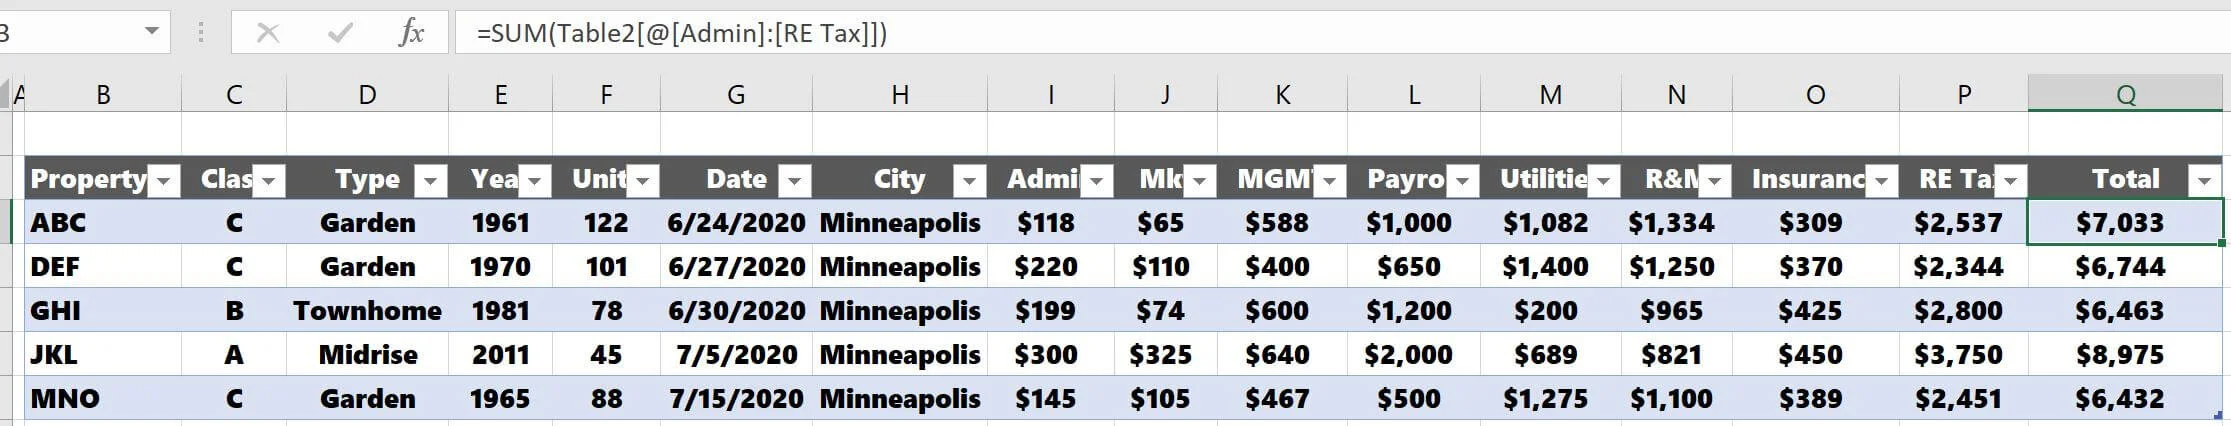
Now, the data is a table. If you add another property to the data set, you will see the table update automatically to include it (See property MNO at the bottom).

At this point, I will also add a "Total" column to "sum" all the individual line items. Once you do the “Sum” formula within the table for one property, the table will calculate the sum for all properties.
Step 2: Converting to Pivot Table
The next step is creating the pivot table, allowing you to examine the data more thoroughly. Again, click anywhere in the newly formed table and insert a pivot table.
I place the pivot table right next to the data on the right side.

Because the pivot table is linked to "Table 1" (You can name the table whatever; I go with the default), anytime you add expense comps to the table, the pivot table will refresh when you right-click on the pivot table and select "Refresh."
Step 3: Filtering Operating Expense Data
Leverage the capability of the pivot table to unearth expense trends. Some standard filtering techniques I would use were:
Average expenses per unit broken down by Class A, Class B, Class C
Pivot Table Fields:

Result:

Class A properties tend to require a higher service level with more amenities, which will drive up per-unit expenses compared to Class B and Class C assets.
Insurance expense trends over the years for Class A, Class B, and Class C apartment buildings
Pivot Table Fields:
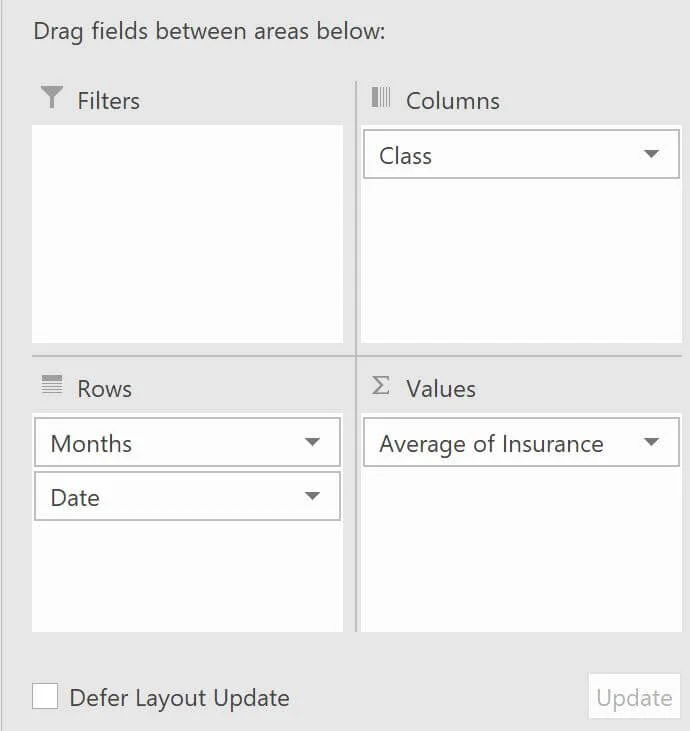
Result:
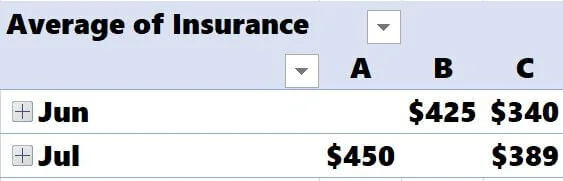
The results above are pointless, with only five expense comps spanning a month of underwriting. Wait until you have one year of data and 100 properties! It was shocking how much insurance rates increased from 2014 until now.
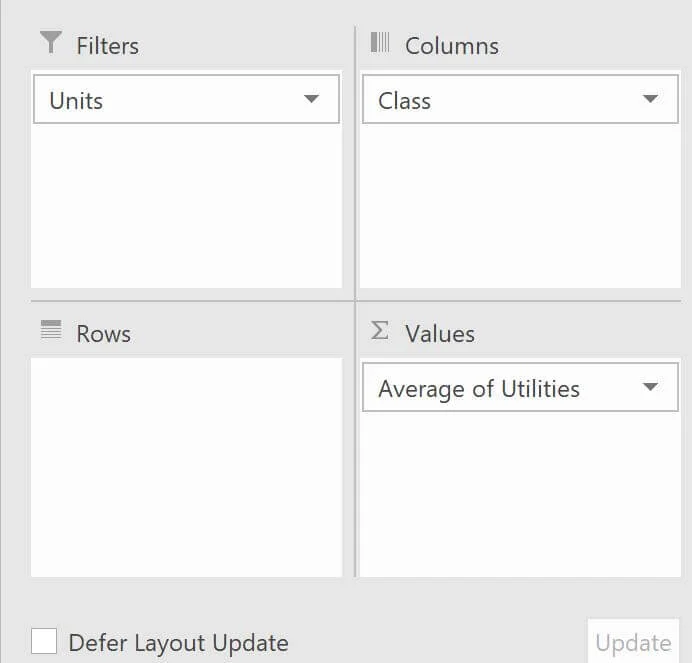
The difference in utility expenses between Class A, Class B, and Class C buildings over 100 units
Pivot Table Fields:
Result:
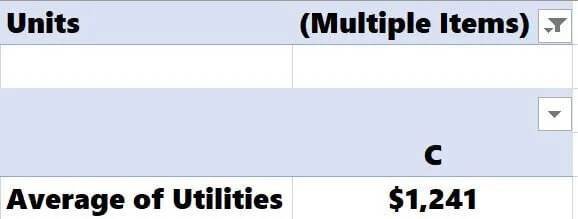
Only two Class C buildings have more than 100 units, and the output is limited. Knowing how many units each comp has is crucial when comparing them. Comparing expenses for a 45-unit property to a 375-unit property is not a good strategy!
It’s also important to note that there is a “Townhome” style comp in this set where utilities are paid by the renter directly to the utility service provider (utility expense was questionably low for ownership). It would be essential to filter out “Townhome” style units when comparing utilities across other styles of buildings so the low utility expense doesn’t skew the data comparison.
Multifamily Operating Expense Comp Database Conclusion
This data will become far more potent as you input more properties. Every brokered deal that hits your inbox can be an expense comp if you take a couple of extra minutes to collect apartment expenses per unit.
Creating your expense comps database is a great way to understand better what a “well-operated” property is. Once you have the workbook set up, it takes little time to add expense comps as you underwrite acquisition opportunities. Over time, you will build up a robust collection of actual expense comps to reference when determining if a property’s historical financials are legitimate.
It’s also a great way to benchmark how you manage your property or how your property management company compares to the comps.