Real Estate Investment Insights: The Power of Unlevered IRR
You've likely noticed a trend if you've used a Tactica proforma. Most proformas include an "Unlevered IRR." Other investors may refer to this metric as:
Unleveraged IRR
All-Cash IRR
Cash IRR
Most investors won't consider purchasing a project without financing, so why track the unleveraged IRR?
Unleveraged IRR Benchmark
Anytime an investor adds debt to a deal, it becomes inherently riskier. It's crucial to prove that debt returns are superior to a "would-be all-cash purchase.” The greater the debt, the more it boosts various investment metrics, the more accretive the financing. Comparing an all-cash IRR to a leveraged IRR makes this exercise far simpler and gives a better frame of reference on how impactful the debt really is.
When there is little difference between levered and unlevered IRRs, it's a red flag that should prompt you to question whether the investment is feasible or the downside is too significant. This proactive approach is vital to successful real estate investment analysis.
This strategy becomes even more prevalent in a high-interest-rate environment where negative leverage runs rampant.
Rule of Thumb
The delta between unleveraged and leveraged IRRs has changed drastically since the cheap-debt era of the 2010s and early 2020s. Generally, the leveraged IRR was about 2x higher than the all-cash IRR over a 7-10-year investment hold in a typical value-add deal. With interest rates over 2x higher and leverage levels much lower in the present, 1.30x - 1.5x is probably a more realistic delta.
Unleveraged IRR in the Proforma
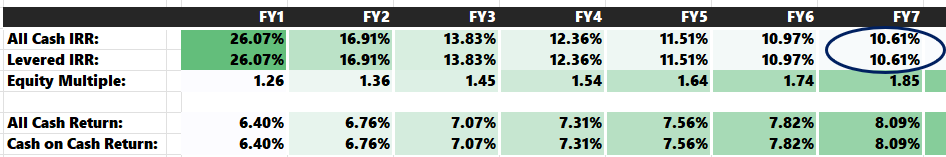
For example, let's look at Tactica's free Multifamily Proforma Template. When we look at the returns, you'll see both the leveraged and unleveraged IRRs for various holding periods (along with equity multiples and cash-on-cash returns).

In this scenario, there is a noticeable clearance between "leveraged" and "all-cash" IRR, which is a great indicator of deal health at the purchase price (in this case, $7,000,000).
Note: Lowering the purchase price (paying less) is the most efficient way to achieve more leverage yield, but it is challenging in a competitively marketed project.
The model runs two separate underwriting exercises simultaneously, so you can compare the returns side-by-side without altering the model.
If we go into our assumption, set financing to 0% LTV:

Returning to the "Valuation" tab, you can see that the IRRs are identical each year.
It would be a pain to constantly change your financing assumption to compare the "leveraged" and "unleveraged" scenarios. To make it easier for you, both scenarios run simultaneously for Years 1-10 of the hold period.
Time Value of Money Matters
IRR is a powerful return metric because it accounts for the time value of money (TVM), meaning cash flows distributed early in an investment have a greater impact on the overall return than cash flows paid later.
Caution: This fact can cause misalignment between partners, so be mindful of the nuance.
In Tactica's Redevelopment Model, a proforma model for distressed projects needing total repositioning, the “Return Summary” tab hosts "leveraged" and "unleveraged" IRRs similar to the free template.

Let's again zero out the financing assumption, as we did in the last example.

When we return to the "Returns Summary" tab, the "leveraged" and "unleveraged" returns don't match! What gives? Let’s look at the IRR details:

First, let's discuss the makeup of this financial model. I built this model specifically for deals that are:
Distressed
Needing renovations
Not eligible for conventional agency financing
Needed short-term bridge financing
Needed to refi at stabilization to get out of short-term financing
Therefore, when we set the financing assumption to "0," the model logic assumes that the equity needed for Purchase and CAPEX is all raised up front.
The Year 0 equity raised = $15,046,876
Meanwhile, the "all-cash" returns assume the CAPEX funds (which span two years) are provided in real time, as needed.
The Year 0 equity raised = $13,715,000
Therefore, these IRRs are higher as there is a smaller cash outlay in Year 0 (but cash flow will be less in Years 1 and 2 when paying for renovations).
CAPEX Funding Risk
There are still risks in "unleveraged" scenarios.
Would you raise cash for repairs on the front end?
Would you raise it as the repairs take place?
Would you depend on cash flow to pay for the repairs?
The longer you wait, the higher the returns will be, but it is riskier. Investors could run out of money, or future cash flow may be insufficient to pay for significant CAPEX.
The most prudent way to underwrite is to allocate all funds for purchases and repairs up front, even if this adversely affects returns, as seen in the example above.
Looking back at the cash flows, the returns will smooth out over time in both scenarios. The total dollars pulled out of the project are the same:
7-Year All Cash Profit: $9,434,451
7-Year Leveraged Profit (w/Debt = 0%): $9,434,451

If you are modeling deals with leverage, which most investors are, I think it’s better to model all-cash IRRs to boost theoretical IRRs as much as possible (less equity in Year 0). This way, the benchmark is higher and forces you to be more critical when comparing “levered” vs. “unlevered.”
Summarizing the Unleveraged IRR
Referencing an unleveraged IRR while underwriting your leveraged project is a great way to assess risk and ensure a good risk-adjusted return. Ideally, financing will be accretive and boost returns; however, this is much more challenging in a high-interest-rate environment.
While paying in cash is rare, deciding the timing of funding for certain expenditures will impact returns. While upfront funding is more prudent for cash purchasers, a significant cash outlay early in the investment hold will affect time-sensitive metrics such as the IRR.
Most Tactica proformas include both "unleveraged" and "leveraged" IRR metrics for multiple holding periods running simultaneously to save the user time and help prevent underwriting mistakes.


