Calculating & Understanding the Debt Yield: Real Estate Lending
When assessing the debt levels and risks associated with property financing, calculating debt yield is usually a low priority. It's not even a metric I track in Tactica's free or paid tools. However, my opinion is changing, and I've noticed an uptick in investors paying attention to this unique metric.
I plan to share how to calculate the debt yield, its benefits, why I've neglected it historically, and how to calculate it in Tactica's free multifamily proforma template (or any financial model).
Contents
Calculating the Debt Yield
The debt yield calculation is simple:
NOI / Outstanding Loan Balance
If the NOI at the property is $130,000 and the outstanding loan balance is $1,400,000, you'd calculate the debt yield as follows:
$130,000 / $1,400,000 = 9.3%
A higher debt yield is better (safer from the lender's perspective) as it will mean either:
The property NOI is higher (more income)
The outstanding loan balance is smaller (less leverage)
This metric is much more helpful for a lender than an investor as it can give them an idea of their likelihood of getting paid back in full (more on this shortly).
Debt Yield Objective
Since the cheap money era of the pandemic, the debt markets have changed dramatically. Loans are harder to get, and some lenders are "pencils down," meaning they no longer fund projects.
It would be wise to start thinking like a lender when evaluating real estate projects that use leverage. The debt yield is a great way to do this.
In a choppy real estate environment, a lender wants to be sure you can pay them back if the underlying property is distressed. They can figure this out quickly by comparing:
Debt Yield to the Market Cap Rate
Ideally, the debt yield is significantly higher.
Debt Yield Example
If the current debt yield at the property is 9.3% (NOI / Outstanding Loan), and sales comps in the market have recently traded at around a 6.5% cap rate, the lender has a nice cushion.
Let's use the example numbers from earlier with an NOI of $130,000 and an outstanding loan of $1,400,000.
If the property sold today at a 6.5% cap rate, that would generate $2,000,000 in sales proceeds, more than enough to pay the first mortgage.
$2,000,000 - $1,400,000 = $600,000
There'd be $600,000 to spare (the investor’s profit).
But what if the property took on distress? Let's say we purchased the building and began redeveloping the property, but we underestimated operating expenses and dealt with a high vacancy that caused the NOI to plummet to $90,000.
Debt Yield = $90,000 / $1,400,000 = 6.43%
Market Cap Rate = 6.50%
Now, the debt yield is slightly lower than the market cap rate. You wouldn't make the lender whole if forced to liquidate this investment.
CMBS
The debt yield is a much more prevalent qualifying metric in the CMBS financing arena, as these loans tend to be non-recourse, and setting a "minimum debt yield threshold" can add another layer of security for the lender.
For example, they may require the debt yield to be at least 9% on the current financial’s NOI. If the yield is below this, the borrower would have to accept less leverage (lower total loan amount) to get above that threshold (via a lower denominator).
Debt Yield vs. DSCR & LTV
In all Tactica proforma models, I track the debt service coverage ratio (DSCR) and require the investor to input a "loan-to-value" (LTV) assumption to calculate total loan proceeds. Generally, a lender will give a loan quote in LTV terms (or loan-to-cost (LTC) for a development project), which you could input into the proforma model.
From there, you'd be able to review the cash flow after debt service and how much clearance there is over the minimum DSCR threshold (generally, 1.20+ is deemed acceptable)
As investors, this is what's important. Ensuring there is enough cash flow to support the loan payments and attain profitability. The debt yield doesn't tell us much, especially over the last 10+ years when asset appreciation was almost a certainty.
But with distress creeping into more real estate investment business plans, it may be worth checking this metric a few times a year by calculating a T3/T12 NOI and dividing it by the outstanding loan amount (excluding supplemental loans or preferred equity).
Debt Yield in the Proforma
Thankfully, adding a debt yield calculation is simple. I plan to show you how to add it to the "Financials" tab of Tactica's Free Proforma Template.
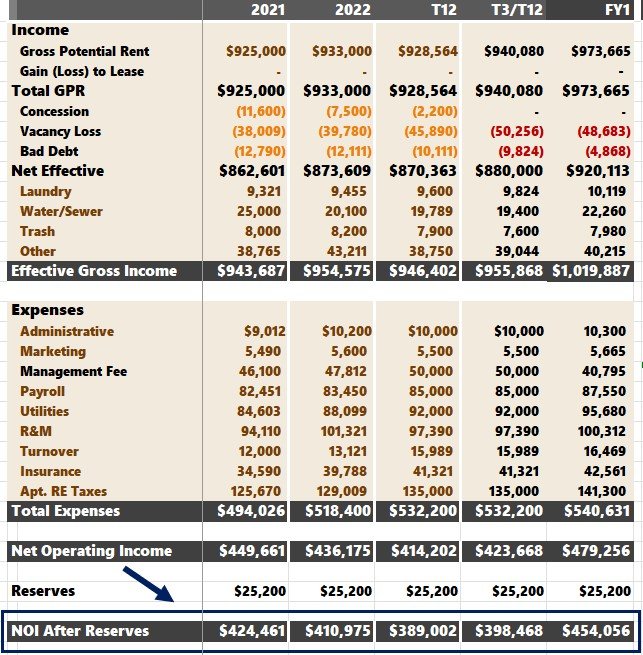
On this tab, we track the historical and FY1 NOIs.
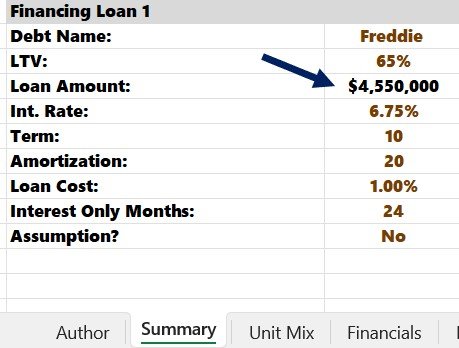
Then, we can get the loan balance from the "Summary" tab.
We can write a formula that takes:
NOI / Loan Balance
(remember to *lock* the loan balance cell when typing in the formula.
And then drag it over.
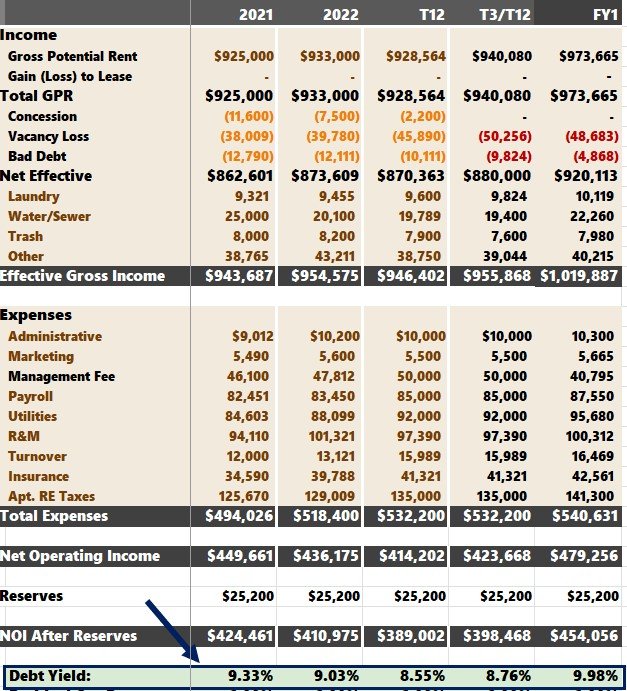
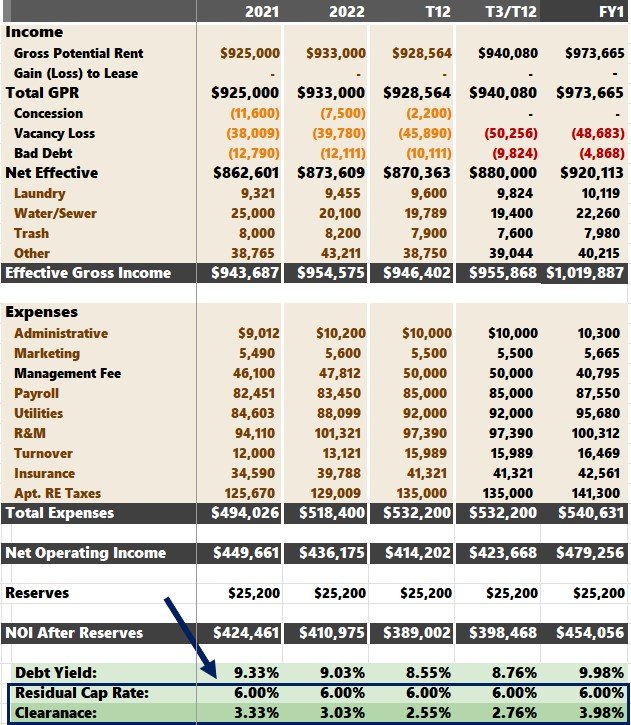
The T3/T12 debt yield of 8.76% is calculated:
$398,468 / $4,550,000 = 8.76%
We should also input the residual cap rate on the "Summary" tab.
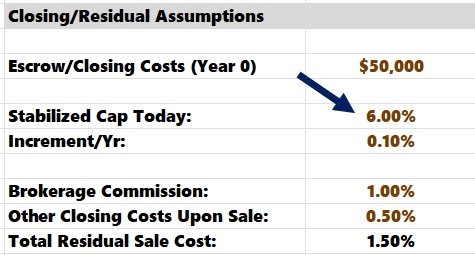
Ensuring a healthy clearance between the cap rate and debt yield is essential. The big emphasis for lenders will be in T3/T12 and FY1.
After year 1, property performance is a bit of a crapshoot with rent increases and the loan paydown.
If a lender has a specific debt yield requirement, typically, they will apply that to the historical NOI. I would focus on T3/T12 amount.

If they required a 9.00% debt yield, you'd need to back off the leverage slightly to get there.
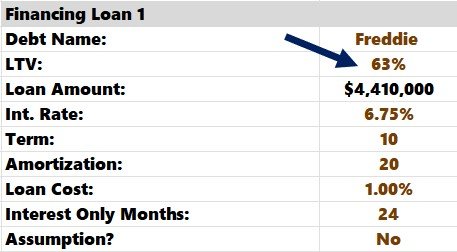
Backing the leverage down to 63% from 65% does the trick ($140,000 less in total loan proceeds).

The T3/T12 debt yield increased to 9.04% after decreasing leverage.
Summarizing the Debt Yield
As investors, we may only pay a little attention to the debt yield because it doesn't necessarily correlate with investment performance like other return metrics do. When stressing the annual debt service, the DSCR is far more common to pay attention to.
However, from a lender's standpoint, it offers a great vantage point of how safe their investment (the loan) is and whether or not they could be paid back in full if the buyer sells the asset in current market conditions.
If you want to add this calculation to your proforma, it's simple. You could apply the same logic to Tactica's Value-Add and Redevelopment Models.
If lenders emphasize debt yield, we should, too, and now you know how to alter a proforma to account for it.


