Real Estate Appreciation & Prudent Multifamily Underwriting
Over the last decade, property appreciation in most real estate markets has been inevitable. Appreciation rates across the spectrum of residential rental home prices to class "A" multifamily have benefited from solid fundamentals pushing pricing thresholds, even if property operations were suboptimal.
Underwriting Property Appreciation
Property Appreciation Definition
Property appreciation is how much more your building is worth from the day you made the purchase. If you bought a property for $1 million and sold it ten years later for $2.2 million, your realized appreciation is $1.2 million. While controllable factors can lead to higher appreciation, there’s also a significant dependence on market factors that are out of your control (such as rising interest rates and cap rate expansion).
Investors have been spoiled to an extent. In the future, it is crucial to dissociate from past trends and process the reality of stagnant or diminishing real estate valuations in a recessionary economic environment.
Real Estate Appreciation Sources
Property appreciation can come in the form of:
Improving Market Fundamentals
Improving Operations
Market Fundamentals
Generally, the individual investor will have no control over the multi-housing market fundamentals. Typically, multifamily real estate is benchmarked with a capitalization rate (cap rate)—the more desirable the market, the lower the cap rate will lead to a higher valuation. Cap rates can correlate with macroeconomic factors such as unemployment trends, interest rates, population growth, and future economic prospects.
In an oversimplified example, property ABC could have been perceived as a 5% cap last year (2021) when unemployment was at record lows, interest rates were low, and overall economic prospects were healthy. Fast forward to now, the economic outlook is cloudy, and interest rates are rising. A reasonable investor may view the same property as a 6% cap to account for the added layer of uncertainty.
Improving Operations
You may be familiar with the term "forced appreciation." It is the notion that you can buy a property, improve operations, and increase the net operating income (NOI). A skilled operator controls this facet of appreciation. Again, if property ABC is valued as a 5% cap, an operator increases the NOI by $50,000 and then sells the property at a 5% cap; in theory, they would see an appreciation of $1,000,000 ($50,000 / 5%). This example is oversimplified, and cap rates, in general, are misleading.
Residual Cap Rate
Property appreciation has always been an abused metric for investors who are overly optimistic about future market fundamentals in the form of a residual cap rate assumption. It's effortless to "finesse" the residual cap rate used in a proforma, and it is arguably the most impactful component of any discounted cash flow analysis. A couple of basis points (bps) can be the difference of millions of dollars in back-end reversion proceeds, which could make a lousy investment appear very lucrative.
I argue that more sophisticated IRR-driven investors tend to depend on appreciation more than smaller, private owners—the latter use more yield metrics such as the cash-on-cash return to evaluate an opportunity. Unfortunately, as cash flow becomes more challenging to evaluate, emphasis on the residual cap rates is arguably more critical to ensure a conservative, realistic proforma.
In Tactica's Free Underwriting Template, Value-Add Model, Development Model, and Redevelopment Model, a section of the analysis solely focused on the residual sales price.
You can toggle the hold period (1 -10 years), and the residual sale assumptions will update automatically. Currently, I have a five-year hold inputted.

You can see that all pertinent “Residual Assumptions” are listed.
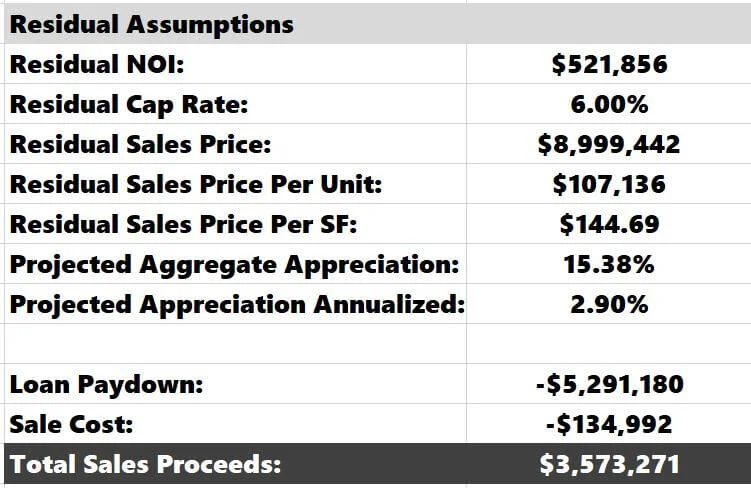
I want you to focus on the "Projected Aggregate Appreciation" and the "Projected Appreciation Annualized." In the image above, the total aggregate appreciation occurring over five years is 15.38%. Annually, this is 2.90%. Generally, I would say that this is a reasonable assumption, considering properties have appreciated approximately 6.52% annually from Q3 2012 to Q3 2022, according to Freddie Mac's AIMI Matrix's national average (United States).
Sensitivity Testing
I would suggest you dive deeper and see how IRRs and equity multiples would be affected if you saw no appreciation over a 5-year hold period.
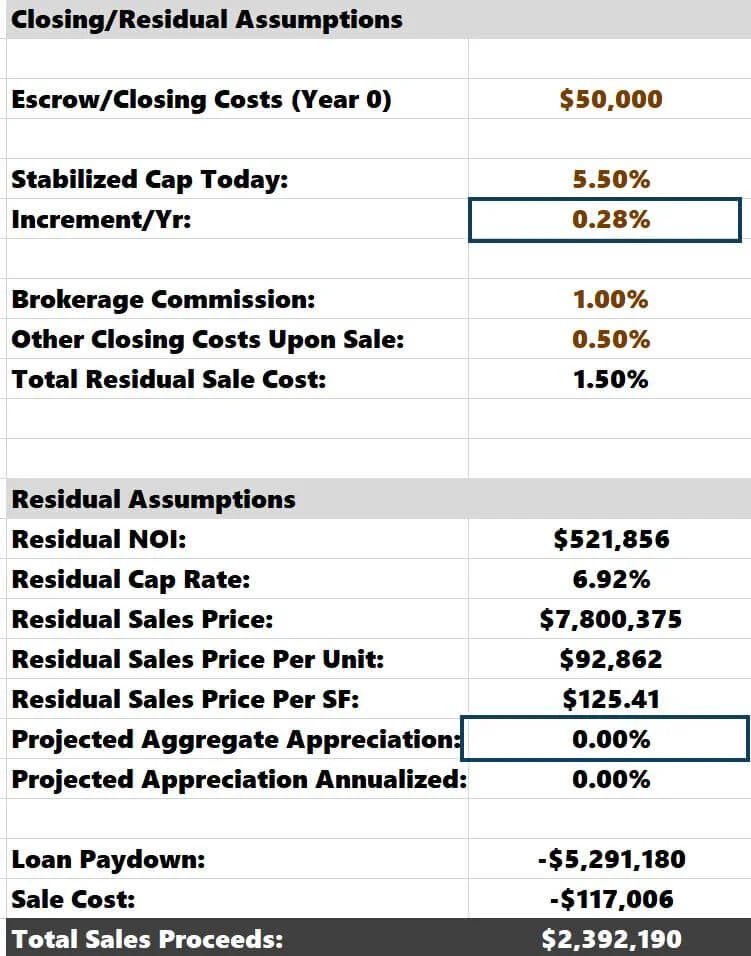
You can see above that the residual cap rate in Year 5 is 6.00% (the expected cap rate is 5.50% today and would increase by ten bps annually per the “increment/yr” inputs below).

The Leveraged IRR is 17.63%, and the Equity Multiple is 2.11 in this sample underwriting run.

We can use Excel's Goal Seek analysis to determine how appreciation would affect the returns quickly. We will use Goal Seek to determine what cap rate increment would cause the total appreciation to equal 0%. All operations data currently in the model will not change. I intend only to tweak the residual cap rate assumption.

In the image above, Excel is figuring out the cap rate during the reversion year by adjusting cell F14 (0.10%) to bring cell F27 (15.38%) to 0%.
The answer is 28 bps, equating to a 6.92% residual cap rate in Year 5.
If we revisit the IRR and equity multiple, while they have been reduced significantly from the previous scenario, they are still positive and indicate a profitable investment.

It is apparent that operating cash flows are healthy and would be conducive to investment metrics—cash-on-cash returns average 7.5% over the 5-year investment horizon. I’ve analyzed plenty of deals that would not be worth pursuing if appreciation weren’t guaranteed.
Summarizing Property Appreciation
All multifamily asset classes have benefited from solid fundamentals, loose monetary policy, and inflation pushing commercial real estate pricing upwards, even if operations were lacking. With interest rates rising and quantitative tightening now a prevalent theme, habits and patterns of the last investment decade should be rethought.
The “Residual Assumptions” section is another tool in your investment arsenal to stress your acquisition opportunity more thoroughly. Because operations will be more challenging to underwrite accurately, overcompensating by maintaining aggressive residual assumptions may be tempting. Don’t fall into that trap!