Excel's XIRR Formula in Investment Analysis: A Superb Reevaluation Metric
While the internal rate of return (IRR) is one of the most popular “total return” metrics in commercial real estate analysis, the less common XIRR serves a unique purpose. This blog post will cover the XIRR function, how it differs from the IRR formula, and show you when it can be helpful when reevaluating your investment during the holding period.
XIRR Function
If you need to calculate the IRR with irregular intervals (varying dates), the XIRR is the formula whose syntax factors all the cash flow and the corresponding dates.
XIRR() = XIRR(Values, Dates)
Assuming your data set had dates and cash inflows, highlighting each column (or row) with the XIRR formula is seamless.

XIRR Contents
Disclaimer
The information conveyed in this article is meant to be informative in nature. When paying investment distributions, you should rely on your qualified legal and accounting team to ensure payments comply with legal documentation and applicable tax laws.
IRR vs. XIRR
The IRR and XIRR calculations are total return profitability metrics that account for the time value of money, unlike other total return metrics like equity multiple and annualized rate of return (ARR).
Investment return analysis in Microsoft Excel tends to gravitate toward a consistent, recurring series of cash flows, and the Excel IRR function tends to do the trick when evaluating investment opportunities in a proforma financial model.
Unfortunately, in real-life investment applications, while we can plan for consistent cash flows after the initial investment, the reality may result in choppier, less consistent cash outflows. We may project the cash flows to look like this:
1/1/2023: ($1,000,000)
1/1/2024: $8,000
1/1/2025: $8,400
1/1/2026: $9,100
1/1/2027: $1,344,000
When realistically, over time, they may look more like:
1/1/2023: ($1,000,000)
5/24/2026: $24,900
10/18/2028: $1,350,000
The IRR calculation works well in the former scenario with periodic cash flows. The Excel XIRR function would be far more valuable in the latter when dealing with more sporadic cash flows.
Related: While Microsoft Excel helps make the IRR financial calculation a simple exercise, the IRR metric is complex under the hood. I take a much deeper dive into:
Converting IRR Projections to XIRR
There will likely be a time when you want to assess the IRR at some point during your investment hold. Perhaps you’ve paid to investors (or yourself) over the past few years but want to experiment with different dates and future payment projections to see how it could affect the overall IRR.
I’m using the Tactica Development Model in the following example; however, the same partnership distribution models are also featured in:
You can apply the same strategies to the IRR waterfall model in any of those three proforma models.
In the initial proforma from three years ago, you can see that we used an IRR formula to calculate cash flow over regular intervals.

However, three years into the project, things are going much differently than projected in the proforma. The initial cash outlay (the negative number in Year 1) is the same. While there was a refinance, it was much less than initially projected (thanks to rising interest rates and more challenging capital markets).
Projected Refi Proceeds: $5,419,288
Actual Refi Proceeds: $3,750,000
The initial estimation was a refinance at the end of Year 2. Unfortunately, the lease-up went slower than expected, and the refinance came seven months later than projected.
Projected Refi Date: 12/31/2021
Actual Refi Date: 7/30/2022
While the original plan was to sell the asset in Year 7, we now want to sell around Year 4 as we don’t expect cash flow distributions to be significant, with inflation impacting operating expenses.
Goal: We want to plug in the ACTUAL distribution data (the contribution and refinance on the specific dates). Then, play with potential future distributions and the residual sale scenarios to see how they affect the GP/LP IRR waterfall splits. Essentially, two more positive values will factor into the final return, and we want to experiment with those payment dates.
1/1/2020: ($9,793,588)
7/30/2022: +$3,750,000
Future Distribution Date:?
Future Sale Date:?
XIRR Conversion
We need to make a few adjustments to the IRR waterfall model to allow for XIRR functionality.
First Step: Copy (right-click) the IRR waterfall tab, rename it “XIRR,” and make it red or another bright color to stand out.
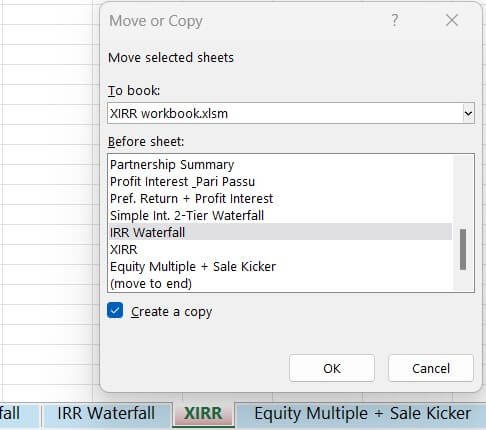
You don’t want to overwrite the original “IRR Waterfall” tab, as the subsequent steps involve overwriting formulas. We need to go into the IRR logic and update a few formulas.

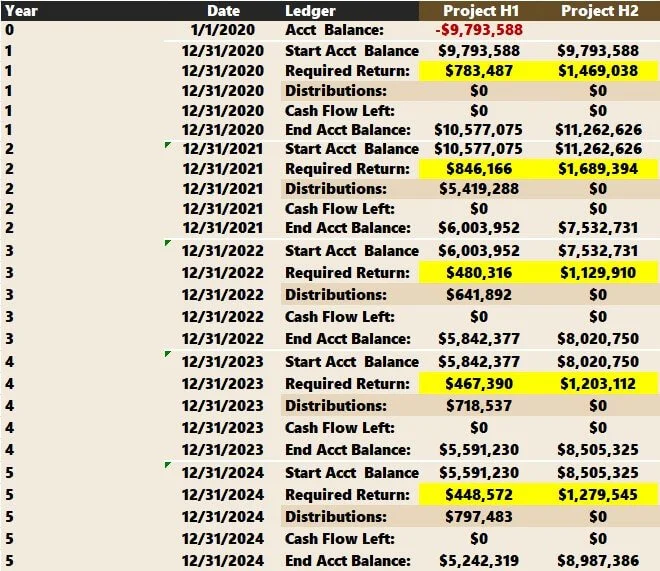
You can see there are two cells highlighted yellow. These are the required return formulas for Hurdle 1 and Hurdle 2 during Year 1.
The current formula stipulates that each hurdle's starting account balance should be multiplied by the respective IRR amount.
Hurdle 1: $9,793,588 x 8% = $783,487
Hurdle 2: $9,793,588 x 15% = $1,469,038
Here’s how the formula looks for Hurdle 1

The “IF” function tells Excel only to calculate the required return if the investment hold parameter for that given year is less than the desired investment hold. As we discussed earlier, the initial proforma stipulated a 7-year hold. The required return has been calculated since Year 1 in the example image above. Years 8,9 and 10 would be left blank because those years are outside the desired period.
The two formulas for Hurdle 1 and Hurdle 2 required returns to be amended to account for flexible dates.
All I need to do is update the “True” argument of the “IF” formula. Let’s do that with the Year 1’s Hurdle 1 required return.

Looking at the image above, Excel now takes the current period's starting account balance and multiplies it by the IRR threshold (8% in this example) like before. However, the formula also has an exponent that takes the days between the current period and the last period’s payment divided by 365 (I think it looks a lot more confusing than it is).
If more days pass, the required return is more and will tie to specific payment dates. If exactly 365 days pass between payments, the amount paid will be identical to the formula we replaced. See below:
Old Formula: $9,793,588 x 8% = $783,487 = $783,487
New Formula: $9,793,588 x ((1 + 8%)^*(365/365))= $783,487
However, if 548 days pass (or 1.5 years), the new formula can accurately reflect the updated required payment, while the old formula cannot:
$9,793,588 x ((1 + 8%)^ (548 / 365)) - $9,793,588 = $1,199,590
For Hurdle 2, we will copy the exact formula as we did for Hurdle 1 before, except grab the Hurdle 2 IRR Range (15% in this case).

From there, we can copy and paste these two formulas for the required returns for each year (highlighted in yellow).
Until we adjust the dates, the required returns should be identical to what was calculated with the old formula. However, the required return changed slightly in 2024 (Year 5). I racked my brain, trying to figure out why. I thought I had made a mistake. Then it hit me: There’s a leap year in 2024!
The new formula we inputted accounts for one extra day that year; therefore, the required return increased nominally when we adjusted the formula.
The hard part is done. Now, we need to swap out the IRR formulas for XIRR formulas for the following sections:
Project Cash Flows
GP Cash Flows
LP Cash Flows
The dates are already there, so type:
=XIRR()
Grab the cash flows first.
Grab the dates second.

I only included four rows in the formula because, if you recall, we’ll only be inputting four payments:
1/1/2020: ($9,793,588)
7/30/2022: +$3,750,000
Future Distribution Date:?
Future Sale Date:?
Remember: Swap out the IRR formula for XIRR for both the GP and LP columns (green and purple).
Let’s now copy and paste the project cash flows section as values. From here on out, this section will only allow manual inputs and will no longer be tied to the proforma results.
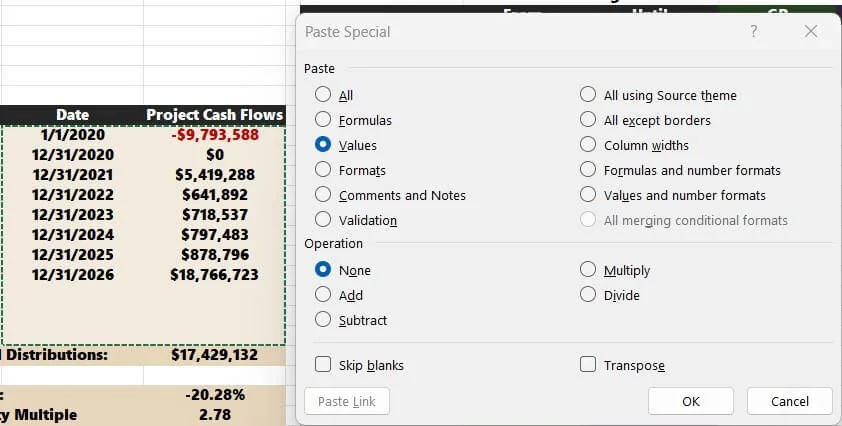
You can also delete or ignore the “Years” column. That’s irrelevant now.
Projecting XIRR
The last step is to play with the dates and distributions to see how they affect cash flows. In our scenario, we intend to sell in the spring of 2024. We also hope to make a $150,000 distribution at the end of 2023 if operations go smoothly.
In 2024, the average debt balance will be around $27,000,000. We sell the asset for $43,000,000 and have a sales cost of 1% of the residual sales value.
Sale: $43,000,000
Sale Cost: ($430,000)
Loan Payoff: ($27,000,000)
Net Sale Proceeds: $15,570,000
Below is the updated XIRR with our new projections.

Note: The italicized dates and distributions are future estimates. In this scenario, the project XIRR would achieve 19.01%, well shy of what was initially projected in the 7-year investment hold of 24.69%.
Let’s pretend there is no distribution in 2023, and your total sale proceeds are only $9,000,000 in January 2025.

In this scenario, the project wouldn’t reach any GP incentive hurdle thresholds, and the project-level returns would match the GP/LP returns. You could experiment with infinite scenarios from this point on. Adjust the three XIRR formulas (Project/GP/LP) as you add more (or fewer) rows of cash flow distributions.
XIRR Video Tutorial
Summarizing XIRR
I’m sure you can see the power of XIRR and its benefits once you’ve commenced a project and want to reevaluate your initial forecast.
There will likely be a time when you want to reassess the IRR during your investment hold. Perhaps you've paid investors (or yourself) sporadically over the past few years but want to experiment with combinations of futures dates and distribution estimates to see how it could affect the overall IRR. Excel's XIRR formula is the perfect tool for this kind of analysis.
Disclaimer: You should always verify with your accounting and legal team that your calculations of payments to investors align with your operating agreements. Always have a qualified third party verify that investment distributions are accurate.