Distribution Waterfalls in Multifamily Investment
While The IRR waterfall is one of the more prevalent partnership distribution structures used in commercial real estate, it is also one of the more confusing models. If you feel intimidated or outmatched by this profit-sharing method, please know you are in good company. I plan to start with the basics of waterfall distribution models and dive deep into logic and nuance.
Contents
Distribution Waterfalls
Generally, a deal sponsor (GP) and limited partners (LPs) will split cash flows from the real estate investment. A waterfall distribution structure is a great way to set investment expectations, lay out various profitability thresholds (IRR hurdles), and define who receives how much distribution cash flow at each step.
Waterfall Nuance
Not all IRR distribution waterfalls are equal. Gamesmanship can happen deep within the weeds that sway distributions toward the sponsor/general partner (GP) or limited partners (LP). I’ve found models online geared towards private equity funds that include catch-up provisions, clawbacks, and double promotes. The tweaks and adjustments are truly endless.
I like to think the IRR distribution model we use in Tactica Underwriting Models is “bare-bones” and easy to digest. If you ever utilize our version to pitch deals to partners or investors, it is paramount that you define the specifics. We prepared something sensible and fair for GP and LP with straightforward functionality.
Why Use a Waterfall Structure?
Real estate owners use IRR distribution waterfalls to incentivize the GP when the investment is fruitful. It’s a way to compensate the GP for their time, effort, and skill in putting the deal together and executing the business plan. The more successful an investment is, the more profits the GP will earn above their pro-rata contribution percentage, often referred to as a “carried interest” in future profitability.
Typically, success is defined by different internal rates of return (IRR) tiers, which stipulate an increased payment to the GP as investment profits ascend.
Related: Five Winning Traits of a Successful Real Estate GP
Let’s begin by walking through a simple example. The plan is to do a one-year repositioning of an apartment building. The property requires $1,000,000 as an equity investment. The GP/LP plan to contribute:
GP: 10% or $100,000
LP: 90% or $900,000
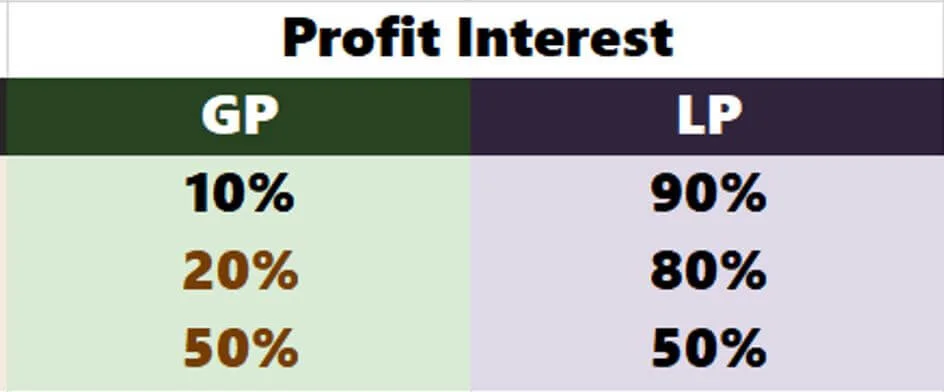
The GP and LP negotiate a waterfall distribution structure that will benefit the GP if the project is profitable. They decided there would be no increased compensation if the project had an 8% or less IRR. The GP will get 10% of the profit back and the LP 90% (matching their initial equity contribution).
If the investment returns 8%, distributions are paid 20% to the GP and 80% to the LP until a 15% IRR is achieved.
If the investment returns are above 15%, distributions are paid 50% to the GP and 50% to the LP.
IRR from 0% - 8% = 10/90 profit split
IRR from 8% - 15% = 20/80 profit split
IRR from 15%+ = 50/50 profit split
For the GP to see an uptick in profits, not only would the LP need to have all invested capital returned, but they would also need to achieve an 8% return on their equity.
Putting these stipulations into the Tactica Excel model would look like this:

Hurdle 1 (Preferred Return) Scenario
Now let’s assume at the end of year one, the investment sells for $1,080,000 and there was no cash flow.
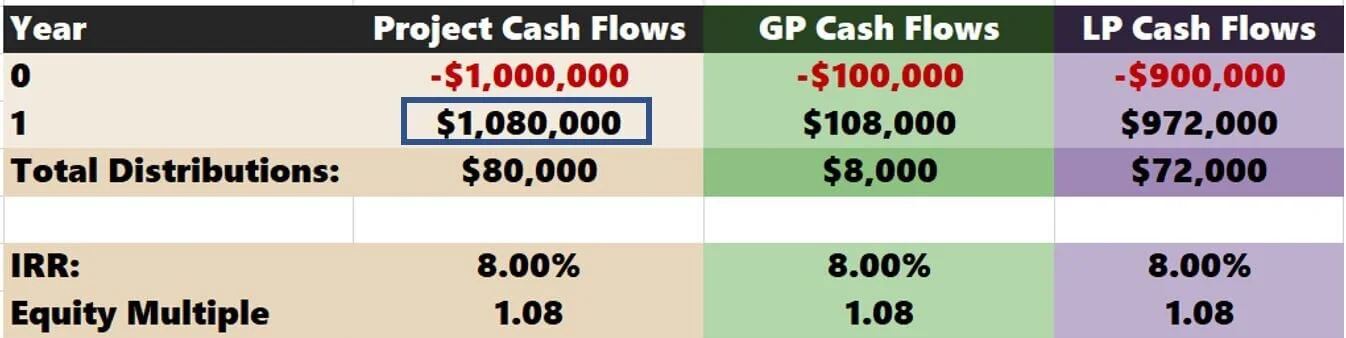
The investment returned no more than the Hurdle 1 rate (sometimes referred to as the preferred return rate but not to be confused with preferred equity) of 8%. Therefore, the GP didn’t see any benefit from the hurdle structure. Everybody was paid back their pro-rata share of the final distribution.
Hurdle 2 Scenario
Let’s say; instead, the investment sells for $1,150,000.
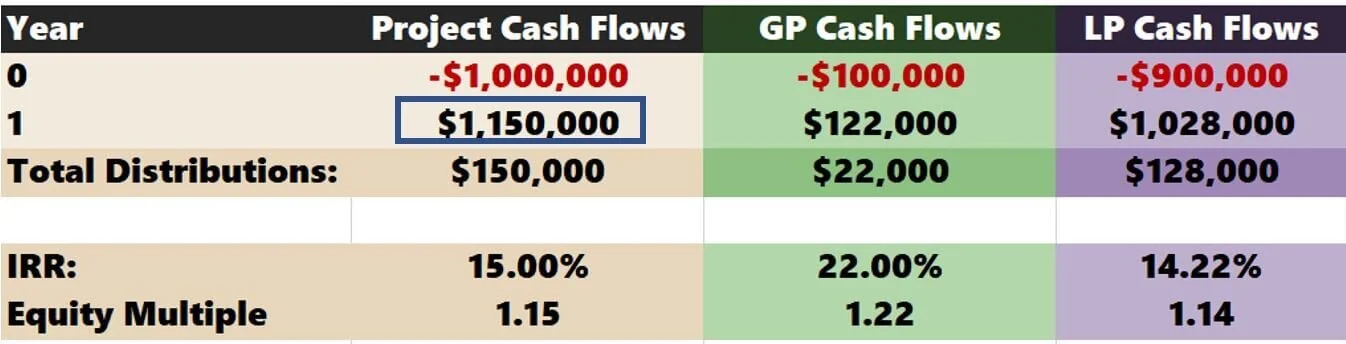
Now, the GP will get into Hurdle 2. This is notable in the image above because the GP IRR is higher than the project IRR. On the flip side, the LP IRR is slightly lower than the project IRR. Let’s take a deeper dive into what is going on.
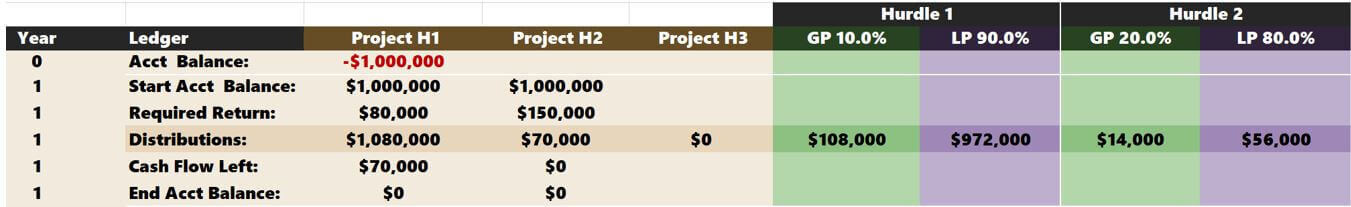
The Tactica model offers an itemized view of these annual distributions. You should interpret the image above as the following:
Proforma years go from top to bottom (in this instance, it is just one year)
Hurdle rates move from left to right
Project-level hurdles are summarized in beige
GP/LP-specific hurdles are color-coded in green and purple
The dark row is the actual “distributions” paid out
For Hurdle 1, the Starting Account Balance is $1,000,000. Hurdle 1 is fully achieved when all $1,000,000 is paid out plus an additional $80,000 (8% Hurdle 1 Rate). The proceeds are split out evenly to GP/LP based on their initial contribution:
10% x $1,080,000 = $108,000 for GP
90% x $1,080,000 = $972,000 for LP
An excess of $70,000 leftover will flow into Hurdle 2. The distribution split in Hurdle 2:
20% x $70,000 = $14,000 for GP
80% x $70,000 = $56,000 for LP
All distributions are dispersed, but the project didn’t yield enough profit to reach the 3rd Hurdle.
Hurdle 3 Scenario
In the last scenario, let’s assume the project sells for $1,250,000.
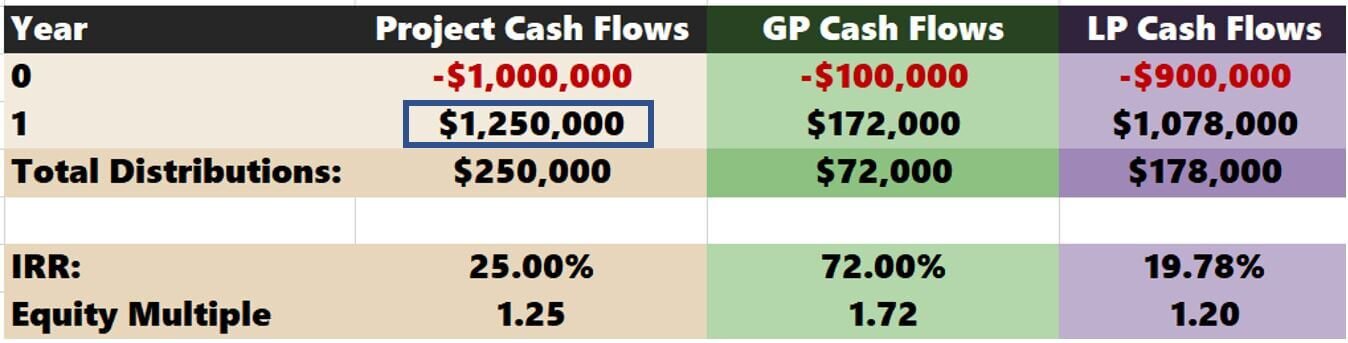
The additional $100,000 sales proceeds would boost the project into the 3rd hurdle. As stipulated above, the Hurdle 3 split is 50/50.

The deeper into the promotion the project climbs, the greater the GP/LP IRRs will vary from the project IRR.
Tactica IRR Waterfall Logic
Let’s talk about two facets of the Tactica model that may differ from other versions out on the web.
Project IRR vs. LP IRR
Hurdle IRR rates are based on Project IRRs, meaning the project must achieve specific IRR targets. Other models out there may base this on the LP’s IRR. This difference would not affect Hurdle 1, but it will affect the distributions of Hurdle 2 and Hurdle 3 (more favorably for the LP).
Using the same scenario above, we can manually calculate what this would look like, but with an LP-based IRR model.
Hurdle 1 would be the same as before.
LP Starting Balance: $900,000
Required Return: $72,000
LP Distribution: $972,000
GP Distribution: $108,000 ($972,000 / 90% - 972,000)
Cash Flow Remaining: $170,000 (1,250,000 – $972,000 - $108,000)
Hurdle 2 would skew slightly towards the LP.
LP Starting Balance: $900,000
Required Return: $135,000
LP Distribution: $63,000 ($900,000 + $135,000 - $972,000)
GP Distribution: $15,750 ($63,000 / 80% - $63,000)
Cash Flow Remaining: $91,250 (calculated as $1,250,000 - all previous distributions)
Hurdle 3 has only $91,250 remaining for the 50/50 Split.
LP and GP would each receive $45,625.
If we compare the two scenarios, the LP benefits more if the IRR hurdle is based on their IRR instead of the project IRR. This discrepancy is most noticeable in Hurdle 2, which leaves less cash flow available in Hurdle 3 to split 50/50.

In this scenario, the LP would see $2,625 more in distributions, adding about 30 basis points (bps) to the LP IRR. It’s not a huge difference, but it can cause discrepancies if negotiations occur between partners with two different models.
Profit Interest
The Tactica model takes a straight profit split.
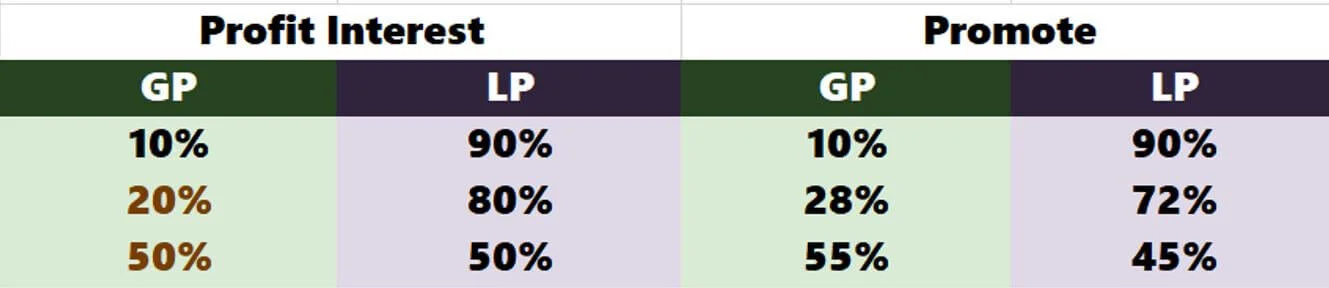
Other models may use a GP promote structure that tacks additional profits on top of their true pro-rata distribution (based on their equity contribution). So, for example, a 20% promote in Hurdle 2 would be:
Promote = 10% + (20% x 90%) = 28%
In other words, if the investment reaches the second hurdle, the GP would have the right to their original 10% + 20% of the LP’s 90%. This method swings the balance in favor of the GP.
I do a straight split (meaning what you see is what you get, 20% means 20%, 50% means 50%, etc.) because it adds complexity to another calculation determining the actual distribution percentage. The graphic below shows how the promotes vary from the Profit Interest in the 2nd and 3rd hurdles.
If you were adamant about doing it the “promote” way while using the Tactica version, you could back into the promote percentages and plug them in as your profit interest percentages.
Unpaid Balances, Accruals, and Compounding
Most real estate investment deals will likely last more than one year. Let's look at another sample deal. Let’s Keep the GP/LP allocation the same (10%/90%) and keep the “IRR Ranges” and “Profit Interests” steady. We will assume this is a more significant project that requires $3,691,000 in equity and is a projected five-year hold.
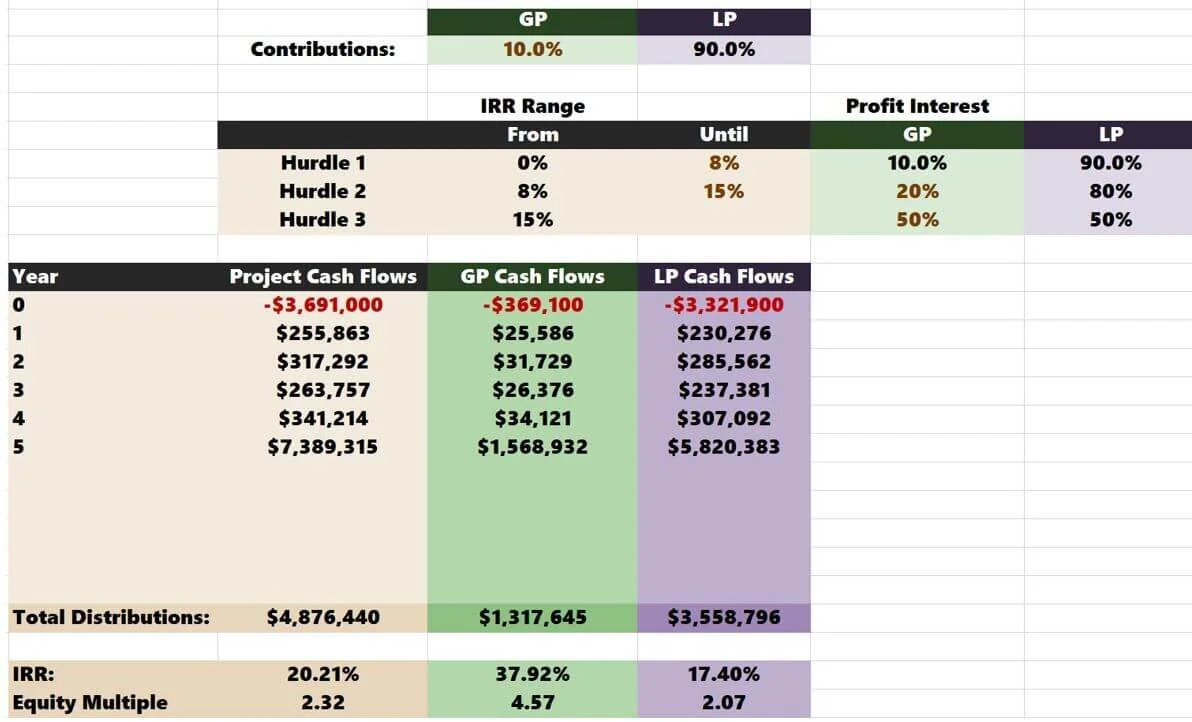
In the summary of cash flows, you can see that most of the upside comes from this asset's sale. When we open up the details, it becomes a lot clearer.
There are a couple of things I want to point out.
This deal doesn’t get into the 2nd and 3rd hurdles until the sale. This delay is relatively standard. It usually takes a capital event to surpass the 1st hurdle.
Early on, the distributions aren’t enough to cover the required return.
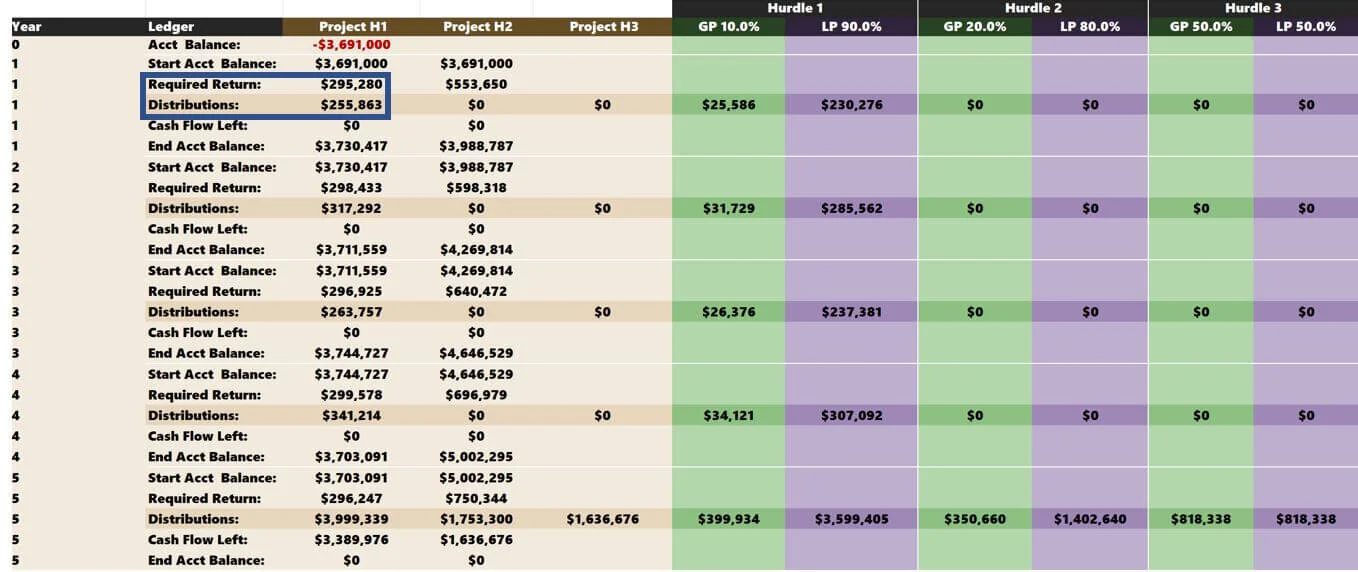
This shortfall is essential because the unpaid balance will carry over to the following year, and the required return will reflect the higher starting account balance. In other words, outstanding amounts will accrue and compound.
Related: Lean about our simple interest waterfall that doesn’t compound unpaid pref.
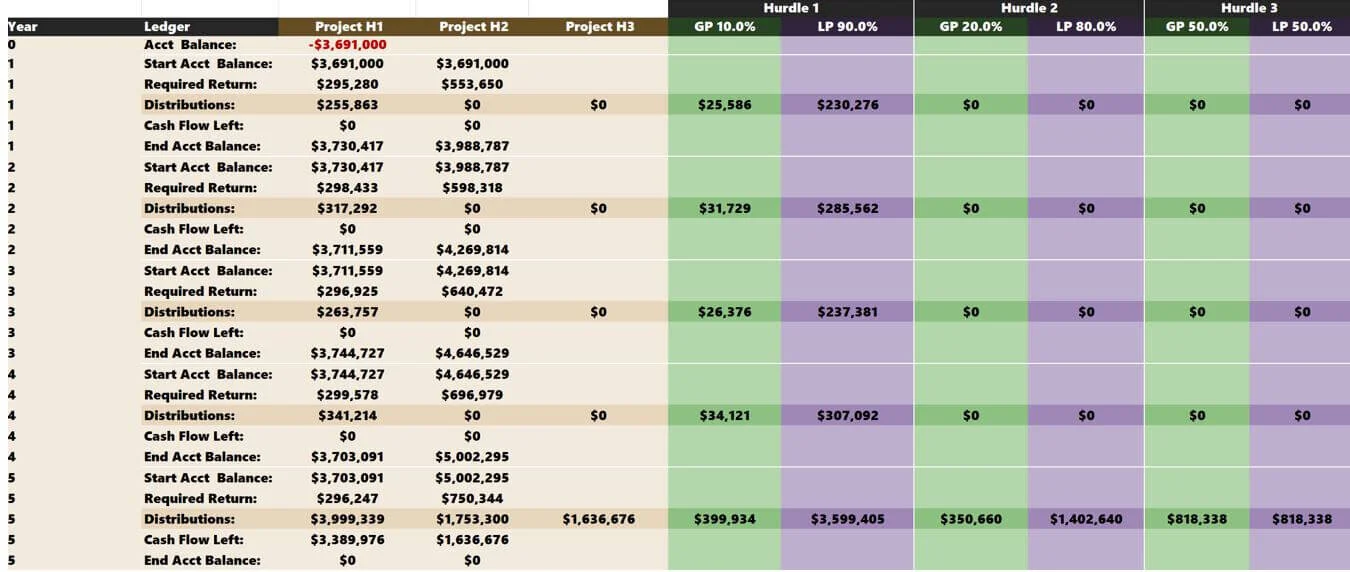
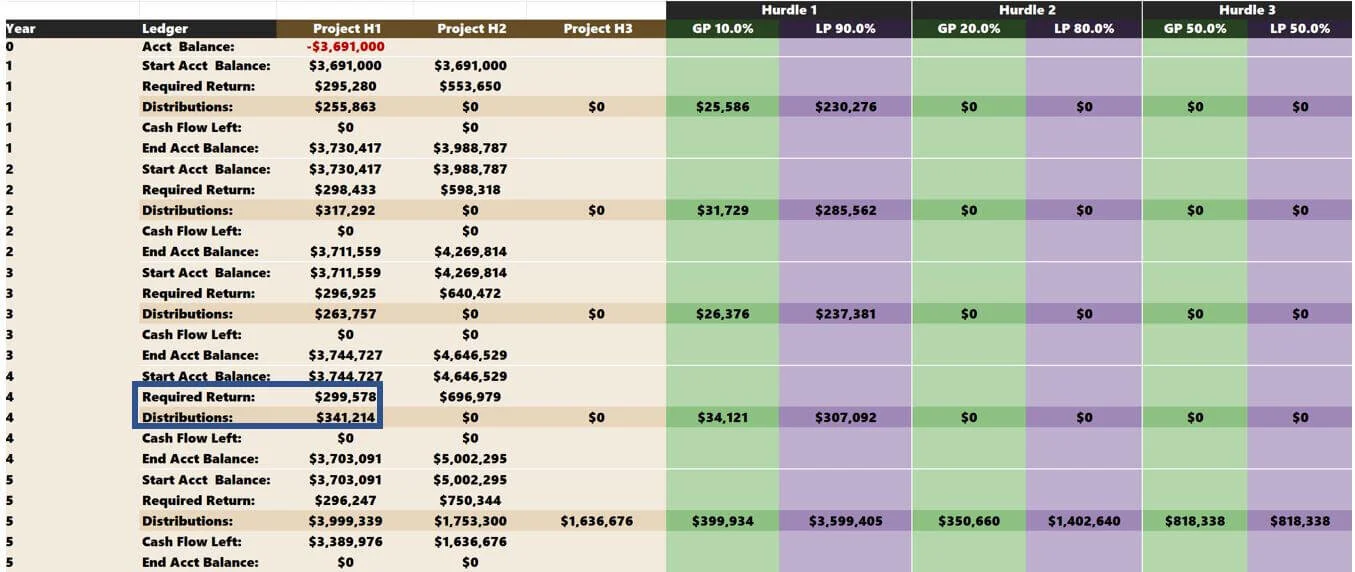
If distributions surpass the required return, the investment balance will decrease the following year, and the required return will fall. This reduction begins to happen in Year 4.
Caution: Waterfalls heavily depend on the asset's sale to see return metrics climb into the mid-to-high teens (15% -19%). Returns are incredibly sensitive to distribution timing. Therefore, to hit higher benchmarks, selling the asset earlier will help inflate returns, catapulting the sponsor into the promote. Check out the “Trifold Alignment Tactic” to learn of a distribution structure less dependent on the residual sale.
The same thing is happening in the “Project H2” column. The only difference is that the distribution is being calculated by taking the starting balance plus the required return minus what was already paid out in Hurdle 1
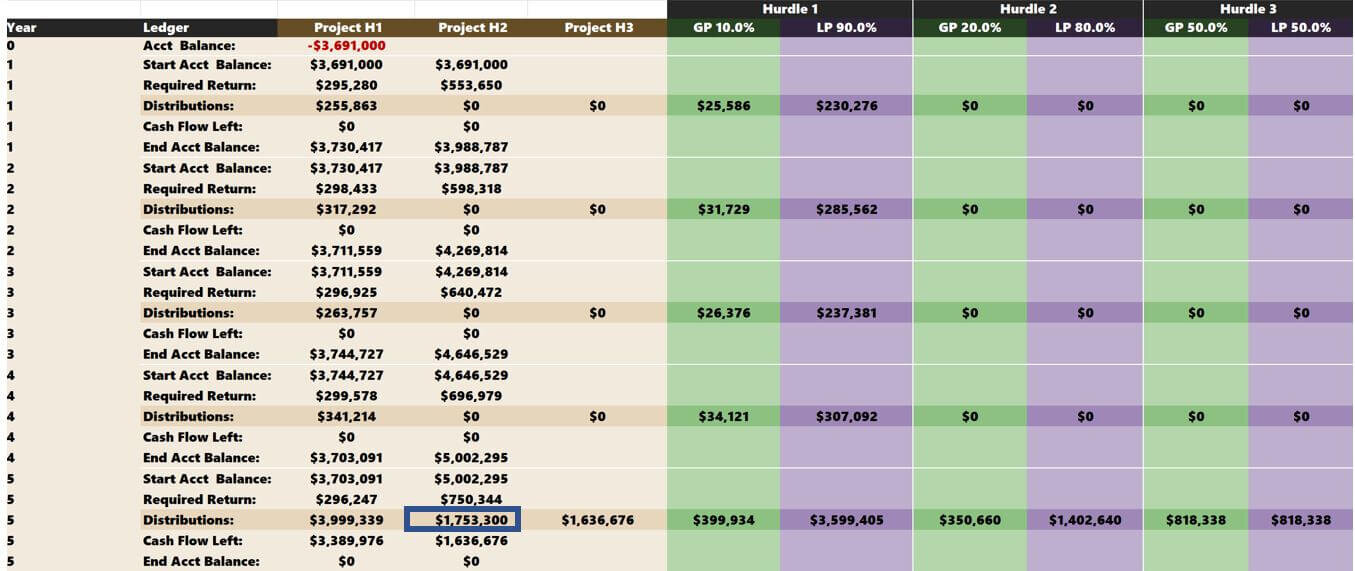
$5,002,295 + $750,344 - $3,999,339 = $1,753,300
If any cash flow remains after that, it is split 50/50. In this instance, $1,636,676 is left over after the second hurdle and is split 50/50 between the sponsor and LPs.
IRR Waterfall Visual Representation
Below is all the above information from the scenario above charted out.
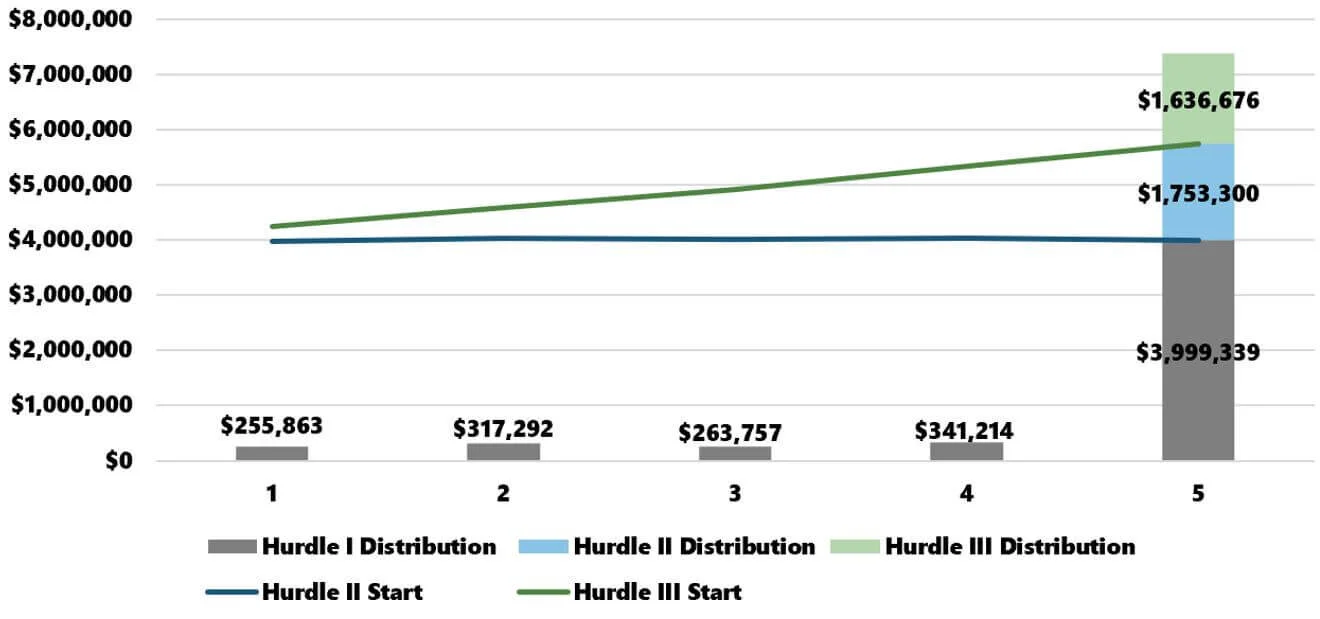
Vertical Axis = Distributions
Horizontal Axis = Years (5-year hold)
The lines represent the hurdle thresholds. The “Hurdle 2” start line stays relatively flat as project distributions are close to fulfilling the required return each year for “Hurdle 1.”
The “Hurdle 3” start line increases annually because distributions are never close to hitting the necessary return of “Hurdle 2” until the residual sale.
Revisiting Waterfall Proforma Projections
There will likely be a time when you want to reassess the IRR during your investment hold. Perhaps you've paid investors (or yourself) sporadically over the past few years but want to experiment with combinations of futures dates and distribution estimates to see how it could affect the overall IRR. Excel's XIRR formula is the perfect tool for this kind of analysis.
Summarizing Distribution Waterfalls
All IRR waterfall distribution models are different and must be investigated thoroughly for passive and JV investment opportunities. When GP and LP investors split cash flows from the real estate investment, a waterfall distribution structure is a great way to set investment expectations and define multiple profitability hurdles and profit splits.
Tactica’s Value-Add, Redevelopment, and Development financial models include the waterfall model featured in this blog post. You can also learn about other Tactica distribution models that could complement the IRR waterfall and provide differing partnership splits for unique investment opportunities.


