IRR For Real Estate Development
The IRR in real estate tends to be the golden investment metric that captures all the facets of property development.
IRR Analysis Contents
IRR Real Estate
IRR is a powerful metric because it measures the total return for a real estate investment opportunity and accounts for the time value of money (TVM). The development holding period can have a tremendous effect on project returns.
Other financial metrics, such as the equity multiple or return on cost, are also beneficial but come up short in a few key areas. The equity multiple is a total return metric but doesn’t factor in the TVM. The return on cost is an excellent yield metric for benchmarking the project vs. other new construction comps, but it won’t provide the total return picture.
Other standard investment metrics, such as cash-on-cash return or applying a simple capitalization rate (cap rate), aren't as valuable with ground-up construction.
IRR Existing Property vs. IRR Construction Project
The first blog post published on the Tactica website was coincidentally related to the IRR and how to analyze the IRR for an existing real estate investment. The article's general concept is digging more in-depth than surface-level IRR. Knowing that the IRR is 15% is great, but understanding how the investment components contribute to that 15% IRR is far more beneficial. I refer to these “components” as IRR sources.
That article will touch on underlying topics related to the fundamentals of IRR sources, specifically what real estate components contribute to the IRR. It will lay the foundation for graduating to IRR analysis on proforma development projects.
IRR Model Existing Property
For an existing multifamily deal (typically value-add real estate), cash flow is derived from initial investment recovery, cash flow, appreciation, and mortgage paydown. Cash flow is often broken into two pieces—cash flow in the first year and cash flow growth for the proforma duration. This is a great way to keep underwriting in check and ensure rent growth and expense cutting are feasible.
Initial Investment Recovery
Cash Flow Year 1
Cash Flow Increases
Appreciation
Principal Loan Balance Reduction
Multifamily development is more complex and throws some wrinkles into the abovementioned IRR sources.
IRR Model Construction
Initial Investment Recovery
Cash Flow
Appreciation
Refinance
Principal Loan Balance Reduction
I don't break cash flow into two categories. In development, you'll solve for a proforma net operating income (NOI) upon stabilization, and rental increases should be modest. Cash flow increases shouldn't have nearly as significant an impact. There is also a "refinance" source, which will play a big part in achieving a higher IRR.
Related: Explaining when the IRR clock starts in Tactica’s Development Model.
IRR Model Disclaimer
IRR sources are subjective. How I classify specific cash flows in the context of the IRR formula is debatable. I could see some real estate investors that consider a refinance as cash flow. Others may consider it a return on investment capital (or initial investment recovery). It's essential to take this lesson with a grain of salt. Hopefully, you can apply the ideas to your commercial real estate (CRE) analysis and tweak them as you see fit.
Update: As of 2024, I will include this analysis in Tactica's Multifamily Development Model.
What Constitutes IRR in Real Estate Development?
Initial Investment Recovery
Can you recuperate the initial equity investment in the real estate development?
Property Development Cash Flow
How much annual cash flow from operations will the property generate?
Appreciation
When you sell the future development, how much more is it worth than the building cost?
Refinance
How much does the permanent financing exceed the construction loan?
Principal Loan Balance Reduction
After the refinance, how much will the permanent financing principal be paid down from the cash flow?
Measuring the Five Sources of IRR
Now, let's measure the IRR of the above sources and determine each source's allocation.
Let's use an example of a multifamily development project with a 5-year hold period.
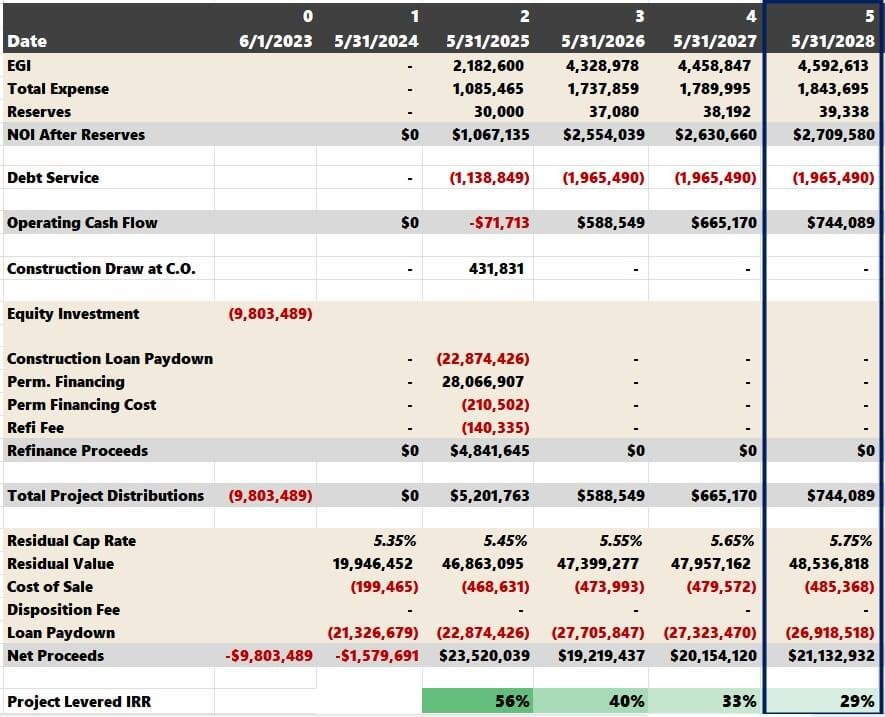
The development model tells us that the project's IRR in this scenario is 29% (technically 28.87%).
Initial Investment Recovery
The first calculation is to take the present value (PV) of the Construction minus the Construction Loan Amount:
($32,678,296 - $22,874,807) = $9,803,489

Our discount rate will be the project’s IRR of 28.87% (noted in the first image's green row). Our holding period is five years.
Remember that IRR Sources can be subjective and interpreted differently regarding how sources of return can be classified. I consider the refinance as a return on investment capital. Therefore, I think the FV argument should be:
Initial Equity Investment - Refinance
$9,803,489 - $4,841,645 = $4,961,844

Stated differently, after the refinance, there is still $4,841,645 the investors are owed that must be generated in sale proceeds later.
The updated PV arguments in Excel are:
N: 5 years
I/Y: 28.87%
PMT: 0
FV: $4,961,844
PV = $1,396,018
The PV of returning the initial investment of $4,961,844 in five years is $1,396,018 when discounted at the IRR.
Note: Typically, a land contribution instead of purchasing outright shouldn’t affect this assumption as both are considered equity investments.

The PV result can be seen in “row 0,” where the “PV” Excel formula is entered.
Property Development Cash Flow
The next step is calculating the net present value (NPV) for the five years of cash flow.

Including the "Construction Draws at the certificate of occupancy date" is essential as those funds are used to pay construction interest before the property has enough cash flow to sustain itself.

The NPV is again calculated in “row “0”.
Discount Rate = IRR = 28.87%. Because the NPV formula requires you to select all the cash flows, Excel will deduce that the term is five years and calculate a PV of $942,265.
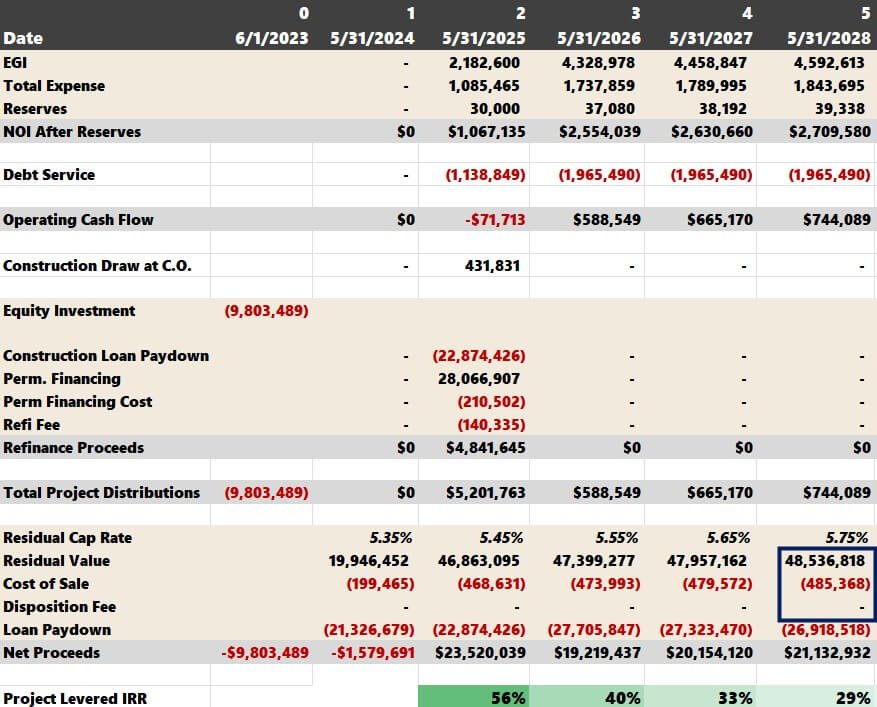
Appreciation
The formula is the following:
Residual Value + Cost of Sale + Disposition Fee - Budgeted Construction Cost + Remaining Construction Loan
The “Residual Value” and “Cost of Sale” are self-explanatory. These amounts are neatly detailed in the proforma.
The "Remaining Construction Loan" and "Permanent Financing Cost" should be discussed further.
Construction Loan Amount Not Drawn
We know that the projected construction cost is $32,678,296.

However, I am cautious with my underwriting and tend to budget for ample reserves for unforeseen setbacks (could be higher construction costs, a longer construction timeframe, or a slower lease-up). The projected construction cost can be higher if extra contingency reserves are underwritten than what is spent in the proforma.
To figure out how many undrawn construction proceeds there are, we can take the total construction budget from the image directly above:
$22,874,807
Visit the "Budget & Draw" tab and grab the final construction loan balance in cell D39:

The difference between them:
$22,874,807 and $22,874,426 = $381
This amount should be tacked onto total appreciation as the ACTUAL construction cost was lower than estimated. Therefore, the property's appreciation is slightly higher.
The final equation for appreciation is:
($48,536,818 - 485,368) - ($32,678,296) + ($22,874,807 - $22,874,426) = $15,373,536

N: 5 years
I/Y: 28.87%
PMT: 0
FV: $15,373,536
PV = $4,325,354
Refinance
The refinance formula is the following:
Permanent Loan Proceeds - Construction Loan Balance + Refi/Loan Fees
We know from before refinancing proceeds are $4,841,645.

The refinance at stabilization takes place in Year 2.
N: 2 years
I/Y: 28.87%
PMT: 0
FV: $4,841,645
PV = $2,915,359
Loan Paydown
The loan paydown calculates the principal you'll pay down during the investment hold. We can ignore construction financing because it is a full-term interest-only loan. The equation for permanent financing is:
Permanent Loan Proceeds - Outstanding Permanent Loan Proceeds at Sale + Refi/Loan Fees
The Tactica financial model tracks this for you.

After five years, $797,553 is paid down.
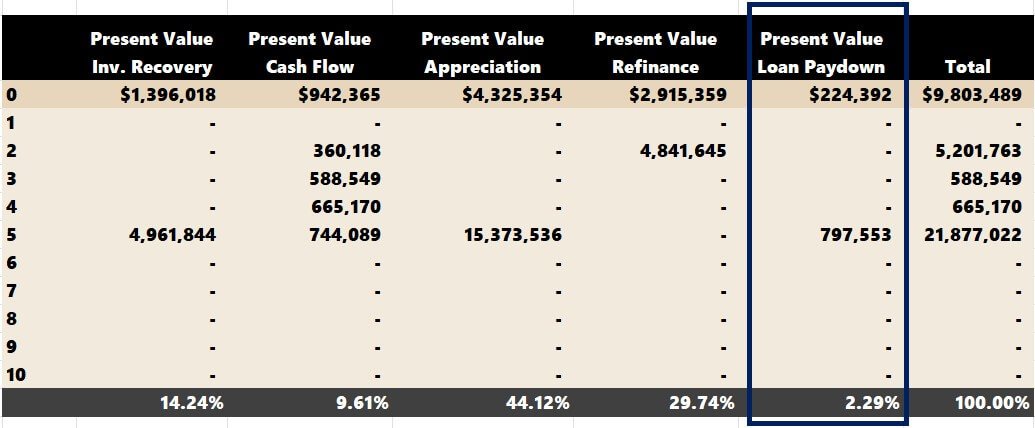
N: 5 years
I/Y: 28.87%
PMT: 0
FV: $797,553
PV = $224,392
IRR Calculation Error Checks
This is a complicated analysis, no doubt. Here are a few additional steps I take to ensure the worksheet is accurate.
Allocations
The allocations should add up to 100%. If they don't, then something is wrong.

Totals
The “Total” cash flow summary should equal the actual proforma cash flows.
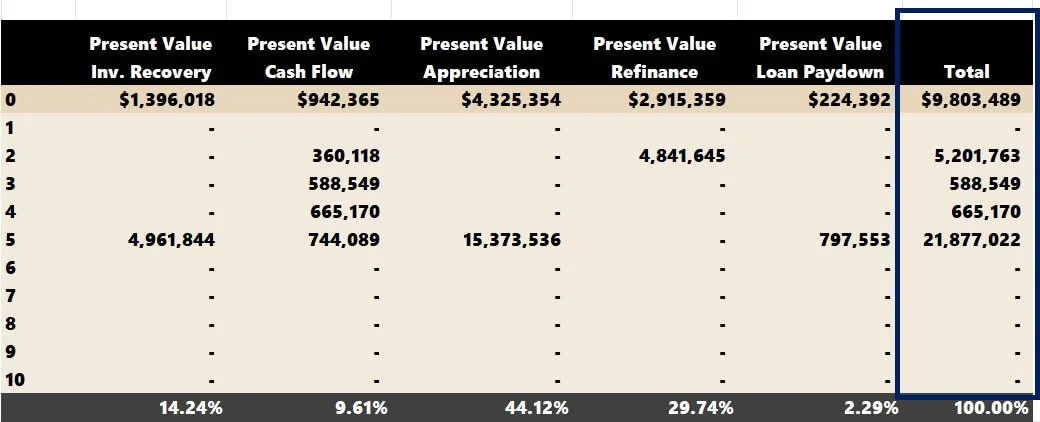
Present Value Totals
The present value "Total" in "row 0" ($9,803,489) should equal the "Equity Required" to fund the deal.
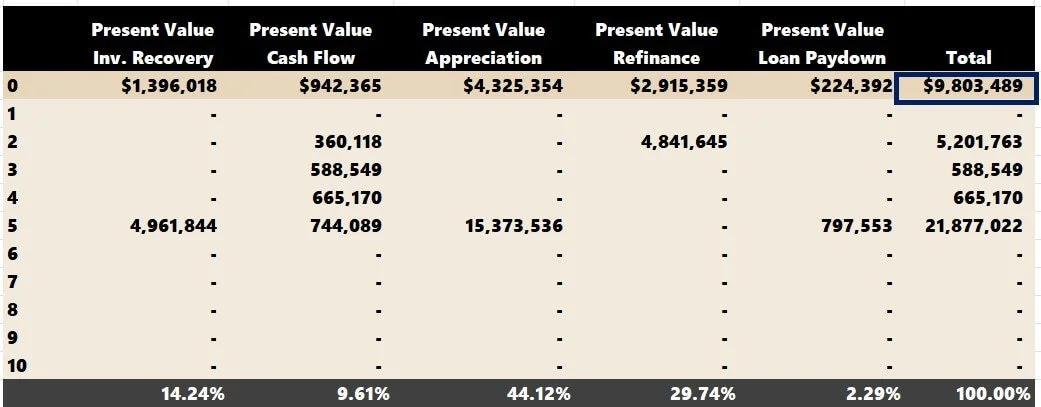
Investment Recovery + Refinance
“Investment Recovery” and “Refinance” totals should equal the equity investment.

With those items verified, you can review the allocations. The most potential return in development projects comes from “Appreciation” and “Financing.” The longer you are willing to hold, the more “Cash Flow” will impact the IRR and, in my opinion, de-risk the project (as you will have smoother, spread-out IRR sources).
This analysis is useless for merchant developers who sell upon stabilization. The entire allocation will be “Appreciation” and “Investment Recovery.” However, it will be more impactful for build-and-hold investors.
Video: Mastering the IRR Intricacies in Real Estate Investing
Concluding the Internal Rate of Return in Construction
This blog post served as a sequel to my first blog post, Analyzing the IRR in Real Estate Investment, which summarized IRR sources for existing properties. The article intended to dive deep and apply that logic to a more complex multifamily development project. The IRR sources are:
Initial Investment Recovery
Cash Flow
Appreciation
Refinance
Principal Loan Balance Reduction
Update: As of 2024, I will include this analysis in Tactica's Multifamily Development Model.
For a more precise measurement of uneven distributions, consider the XIRR.
The logic will be the same even if you use a different development model than I presented in the images above. All you are doing is categorizing cash flows. Best of luck!